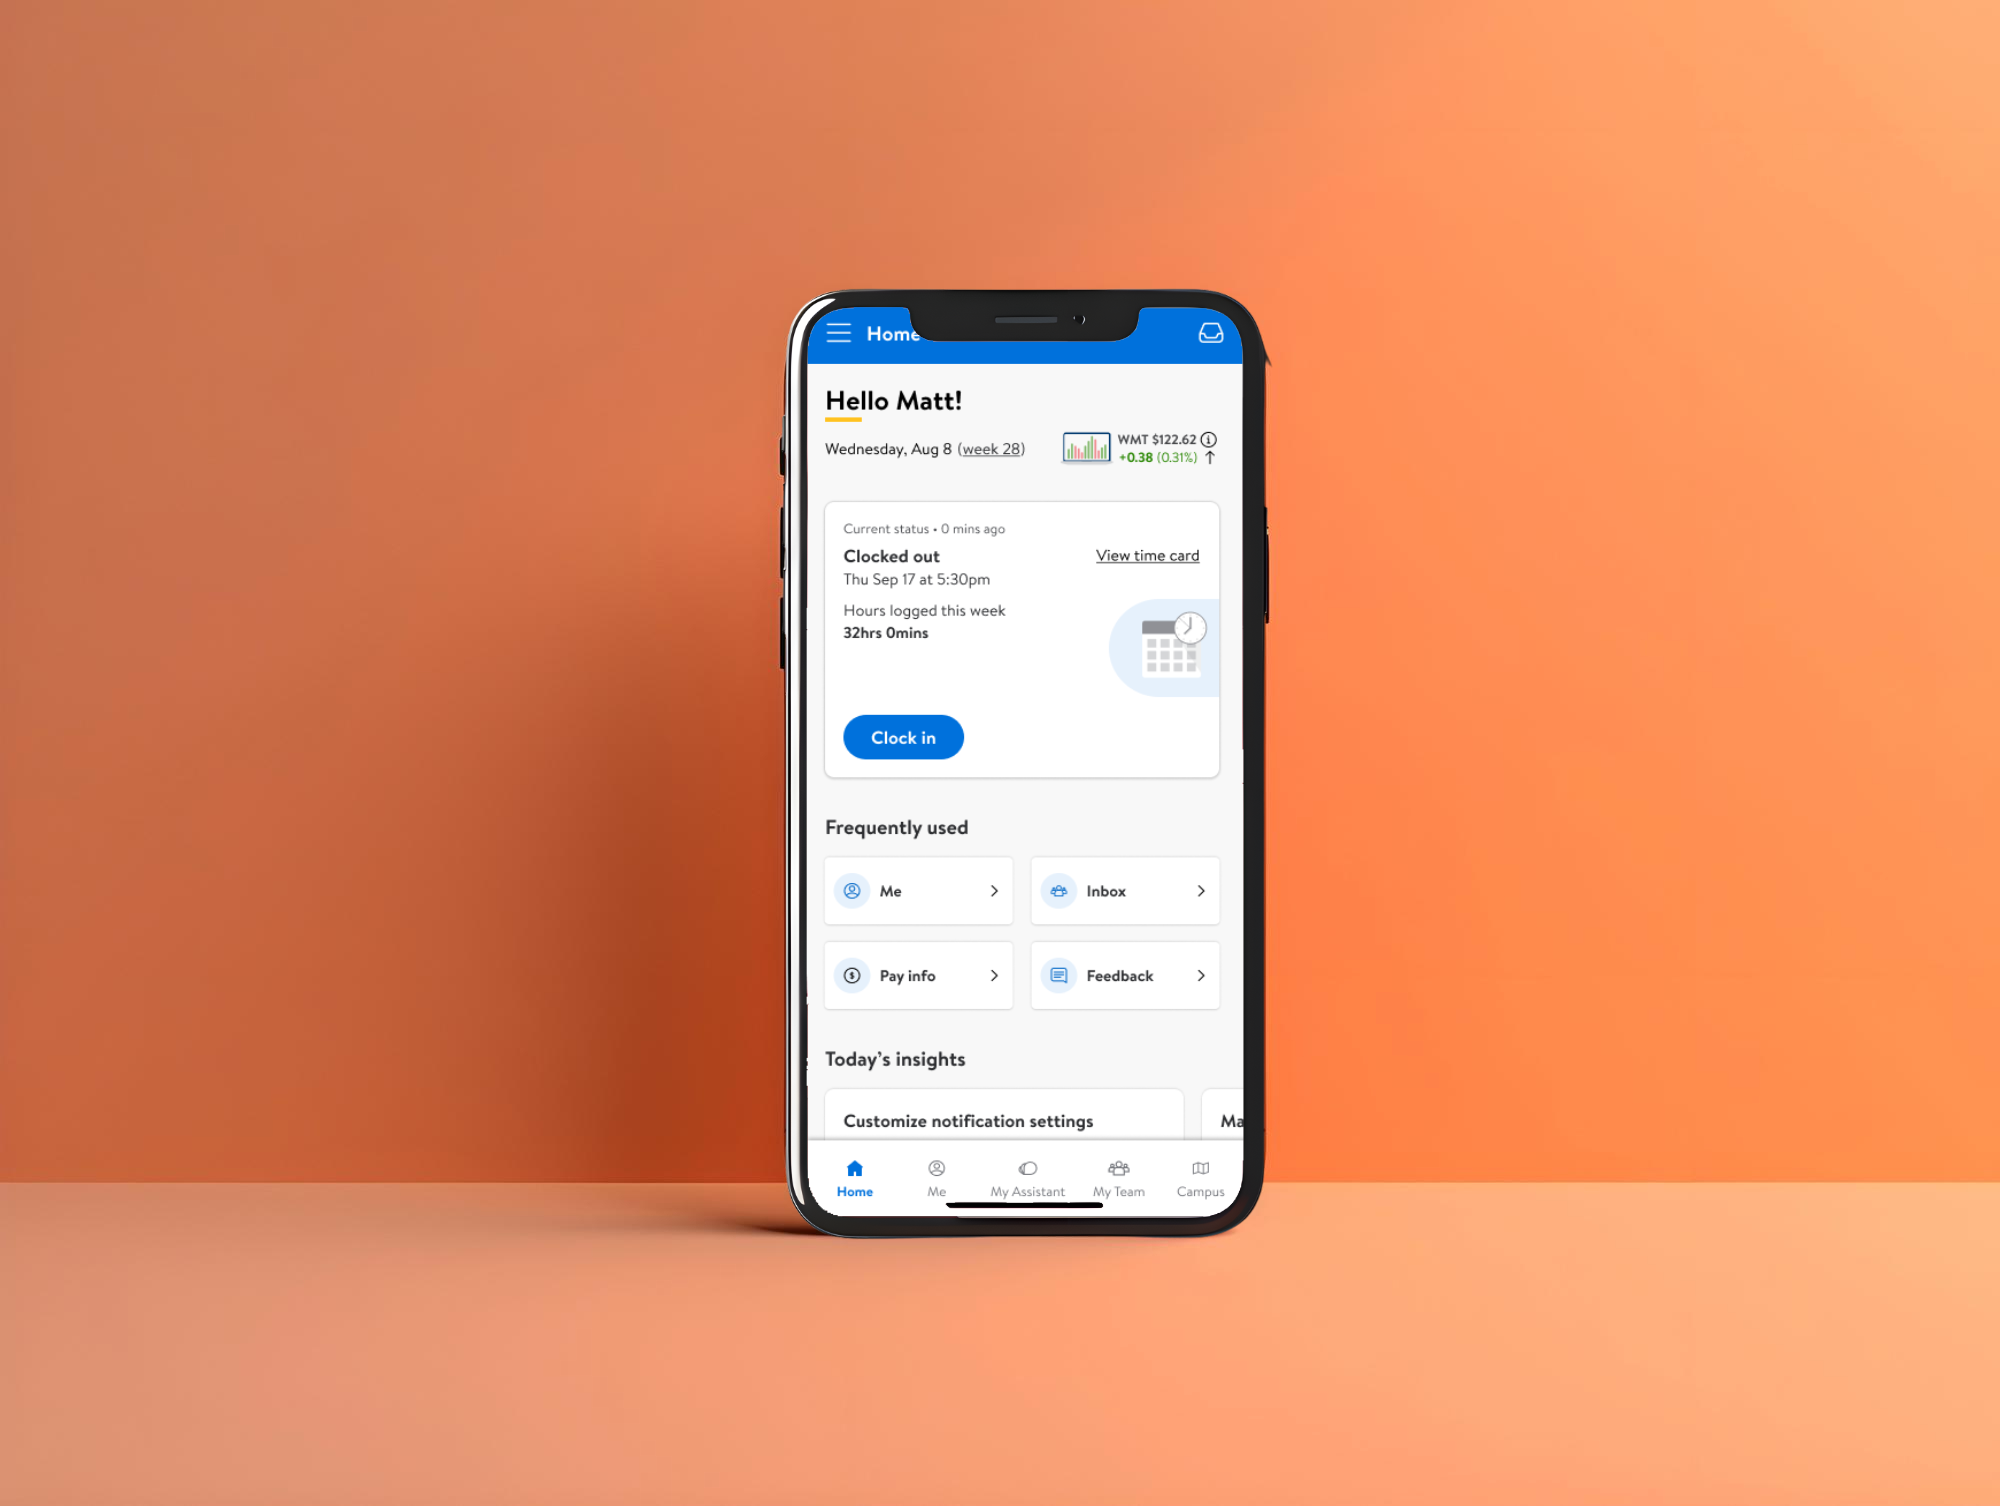
Imagine staring at a clunky, outdated system for clocking in and out – a system riddled with frustrations for thousands of Walmart associates. This was the reality I faced when tasked with re-designing the mini-app to streamline this crucial process.
The Quest Begins: Uncovering Hidden Challenges
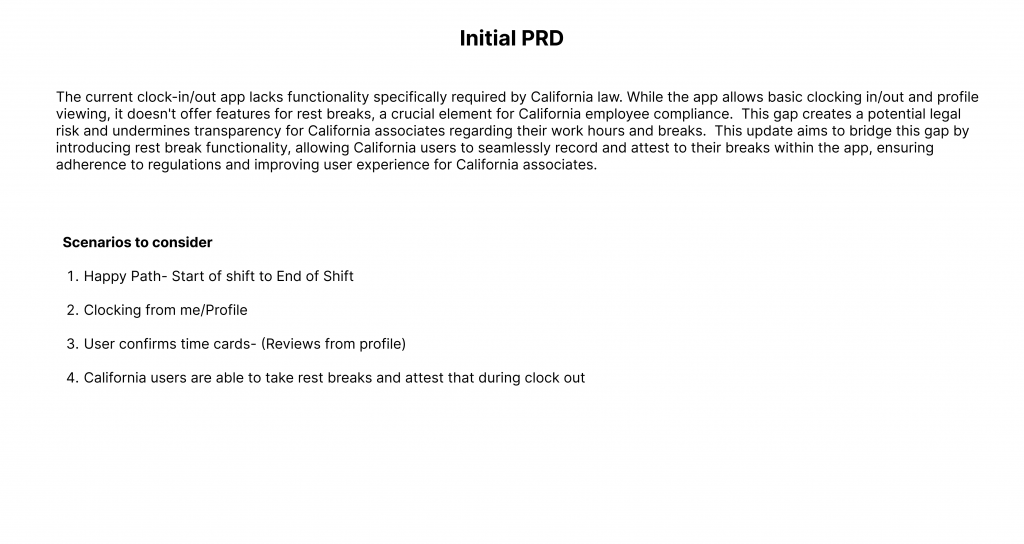
We started with a Product Requirements Document (PRD), the usual roadmap for projects. But as the expert warned, it often lacks depth. This one was no exception. It presented a generic problem statement, limited user scenarios, and an overreliance on a legacy system with no usability data. It was like looking at the tip of an iceberg – the real challenges lurked beneath the surface.
Initial PRD for Clock-in Clock-out Mini-app
Embrace the Unknown: A User-Centered Approach
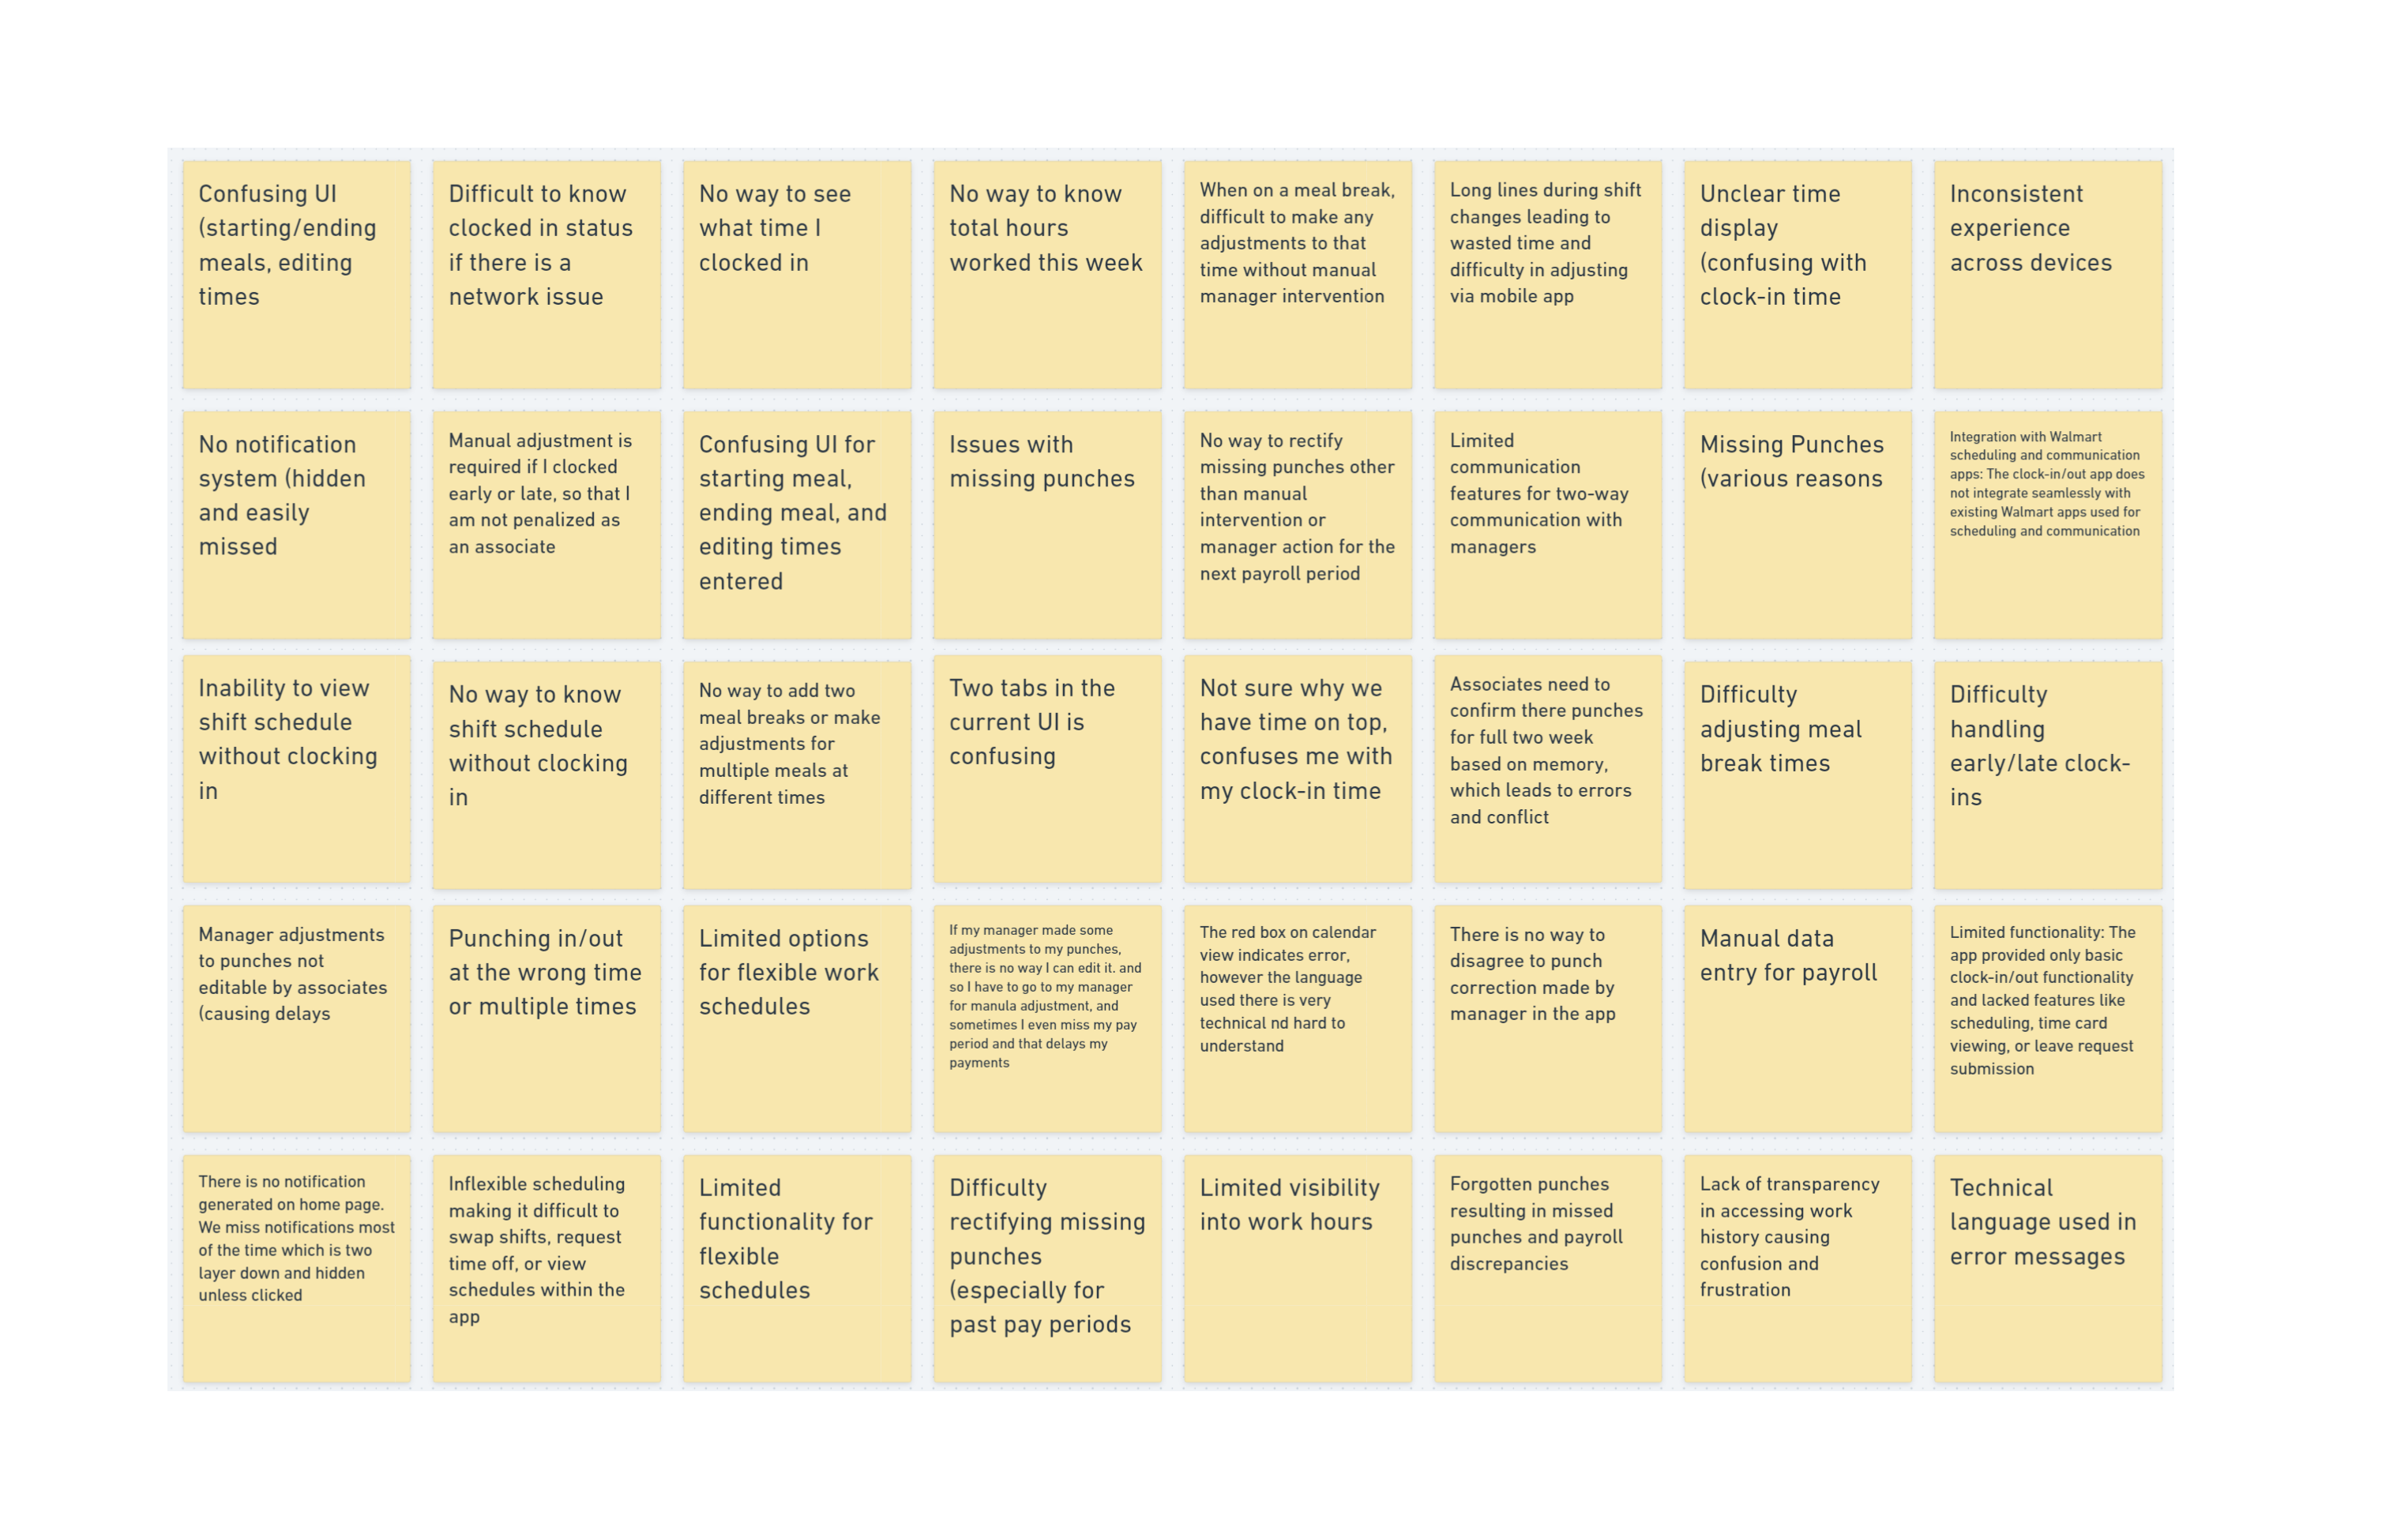
Here’s where the story takes a user-centric turn. I assembled a dream team of UX designers and researchers. Together, we embarked on a mission to understand the associates’ pain points. We conducted in-depth interviews with a diverse group, representing various age ranges, locations, and experience levels. We delved into their daily routines, uncovering a multitude of frustrations:
Difficulty navigating the legacy system
Lack of clarity on process flows
Time wasted clocking in and out
Confusing User Interface (UI) and Information Display
Inaccurate Time Tracking and Management
Integration and Communication Issues
Data Access and Transparency
User Interview Pain points
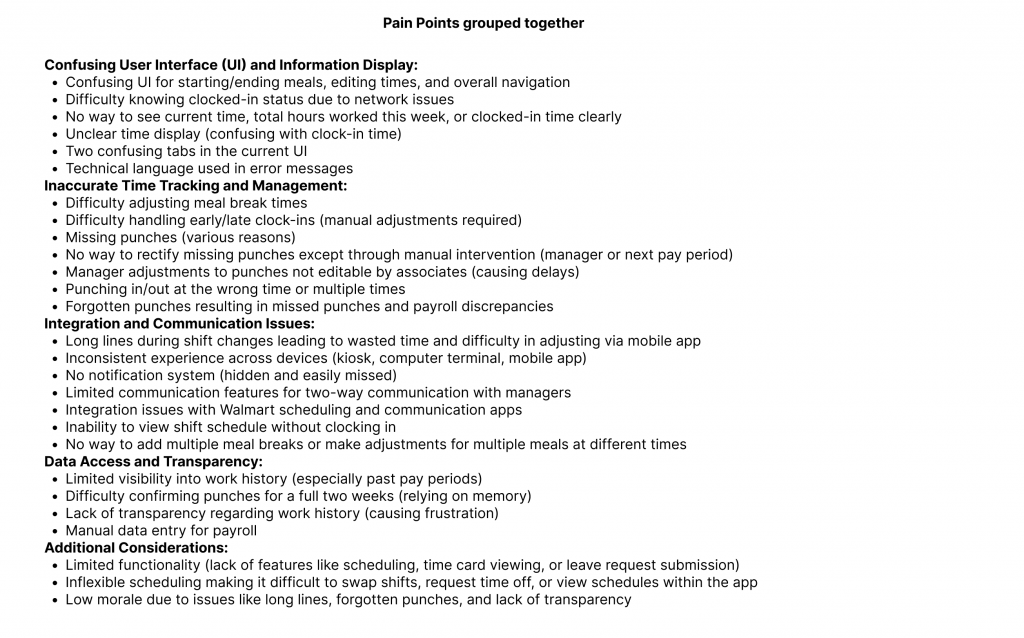
These interviews were just the first step. We employed card sorting to group similar pain points as shown below:
Pain points grouped together
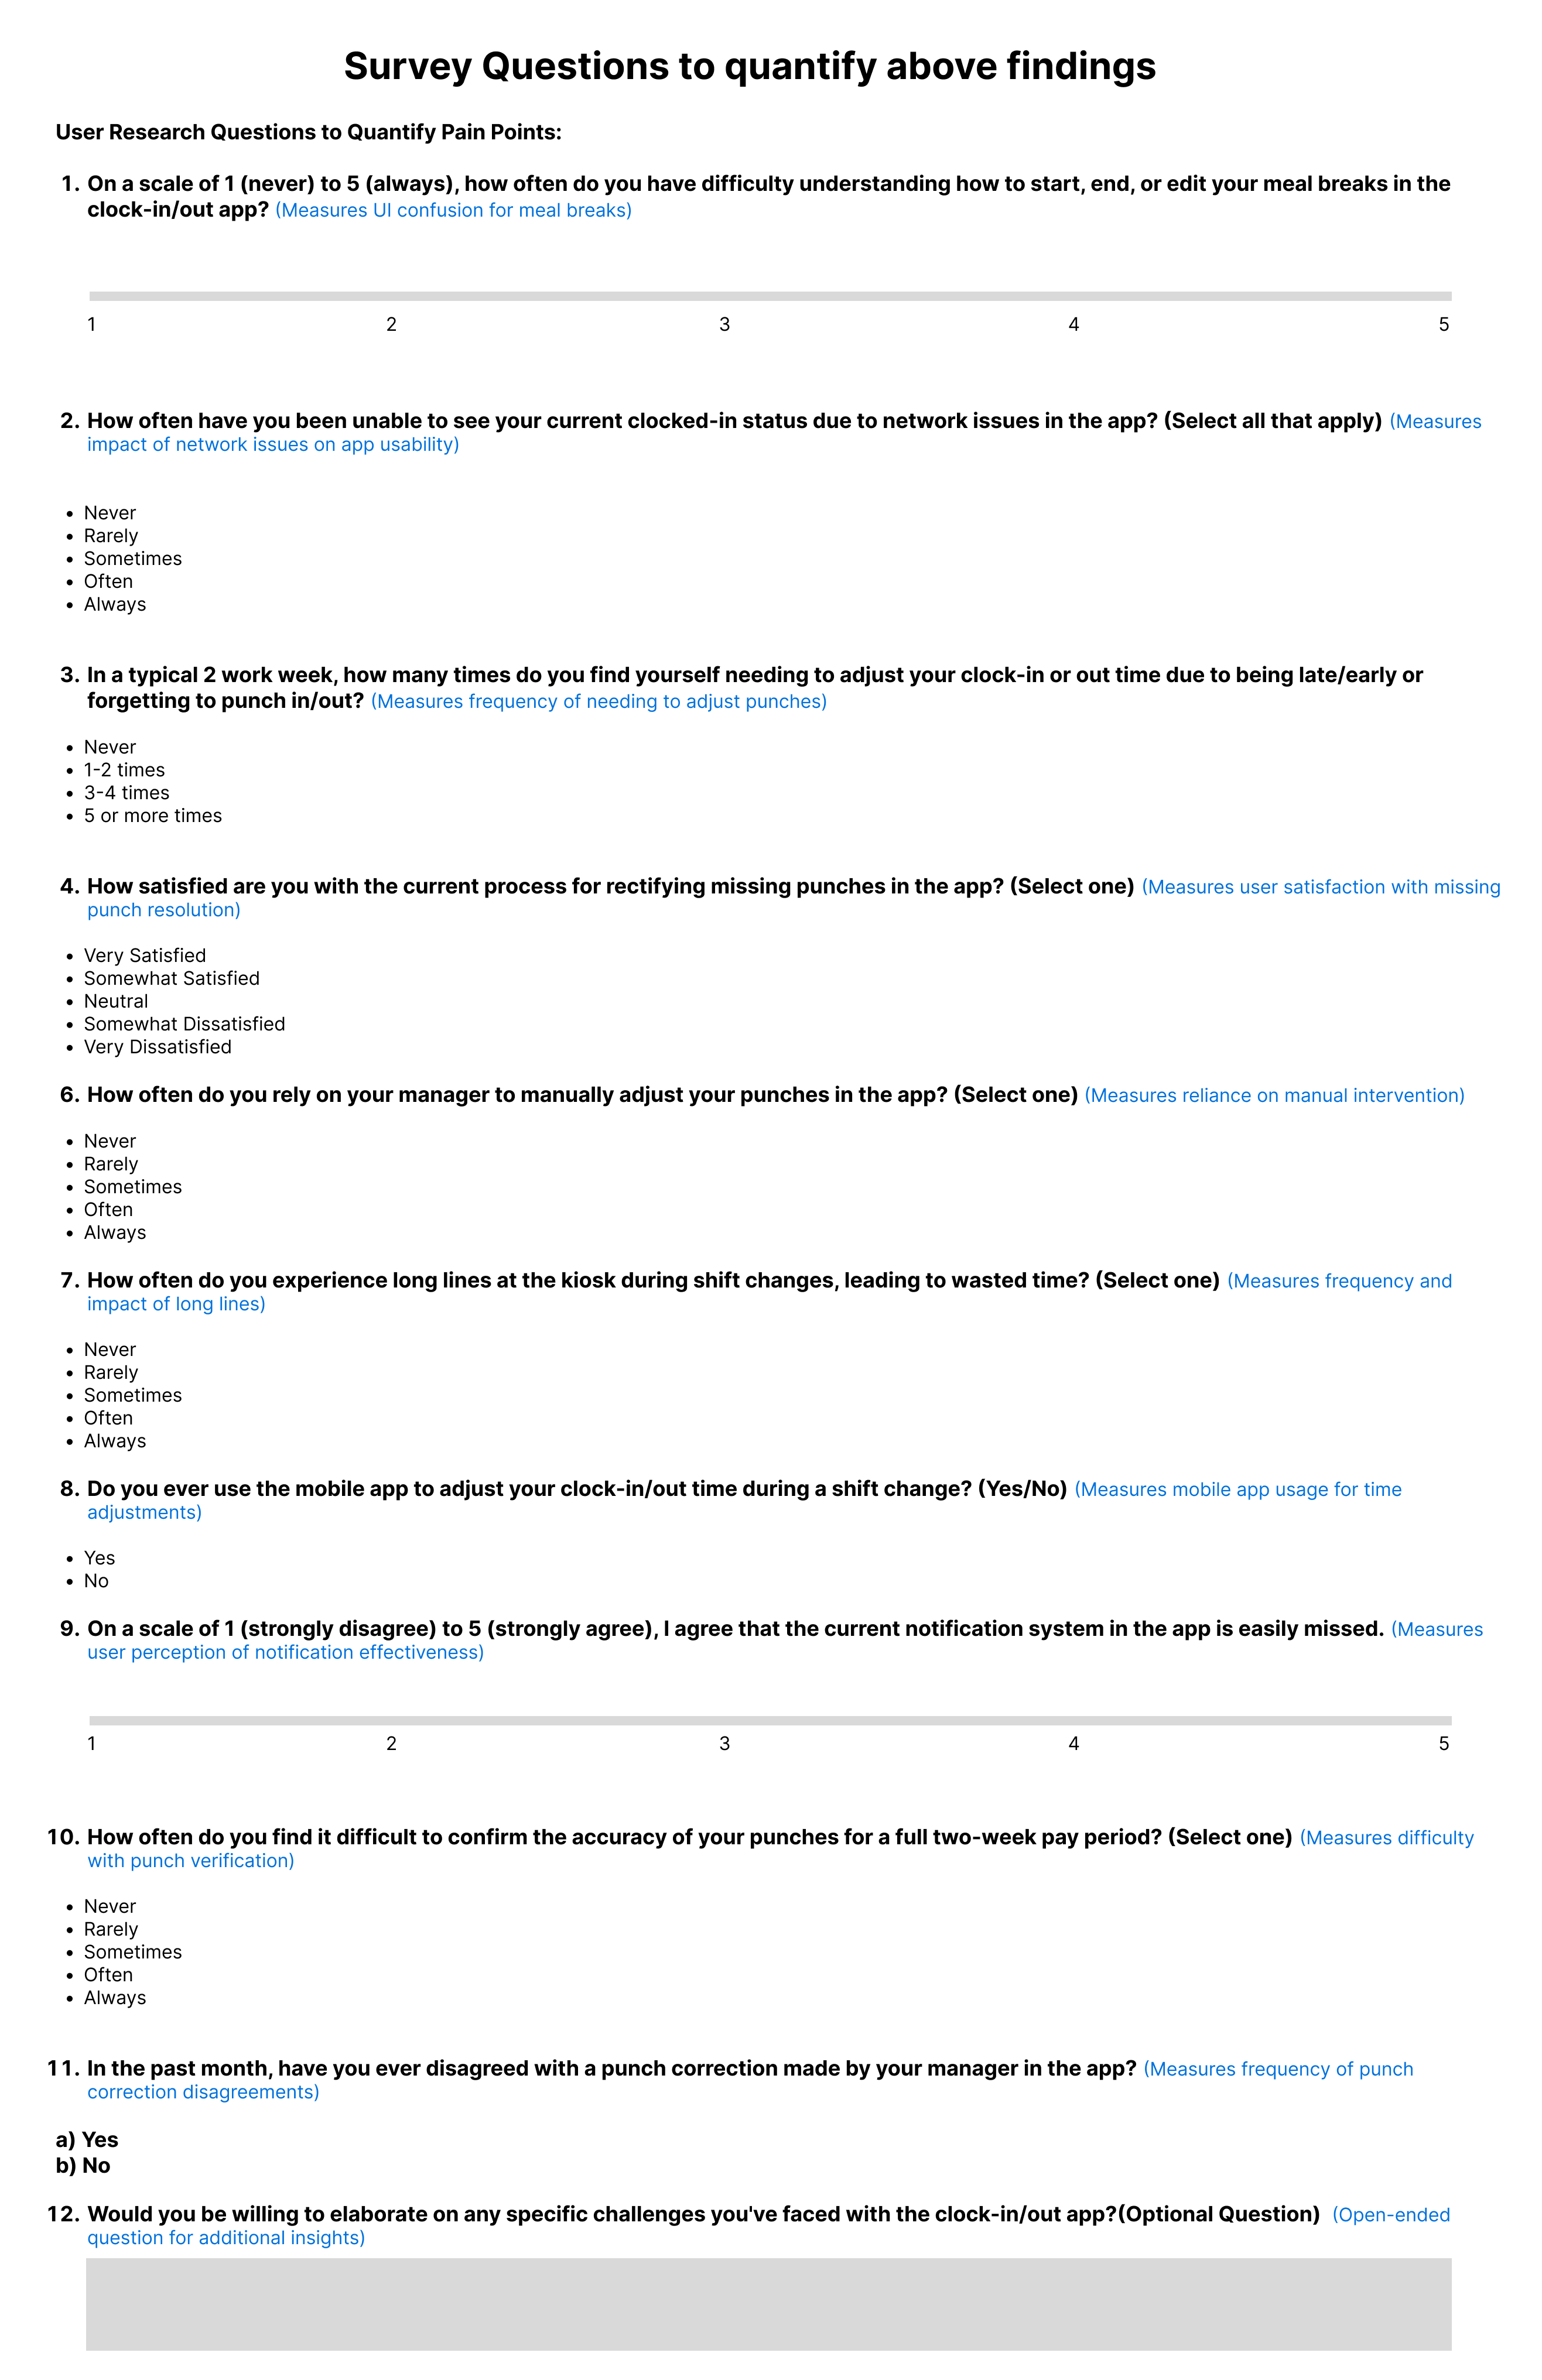
But then I wanted to test if the information we got after interviewing 10 users are edge cases or a genric problem of the whole population. So we conducted surveys to quantify their severity and prioritize them. This comprehensive research revealed a treasure trove of user needs, far exceeding what the initial PRD hinted at.
Survey Questions to quantify pain points
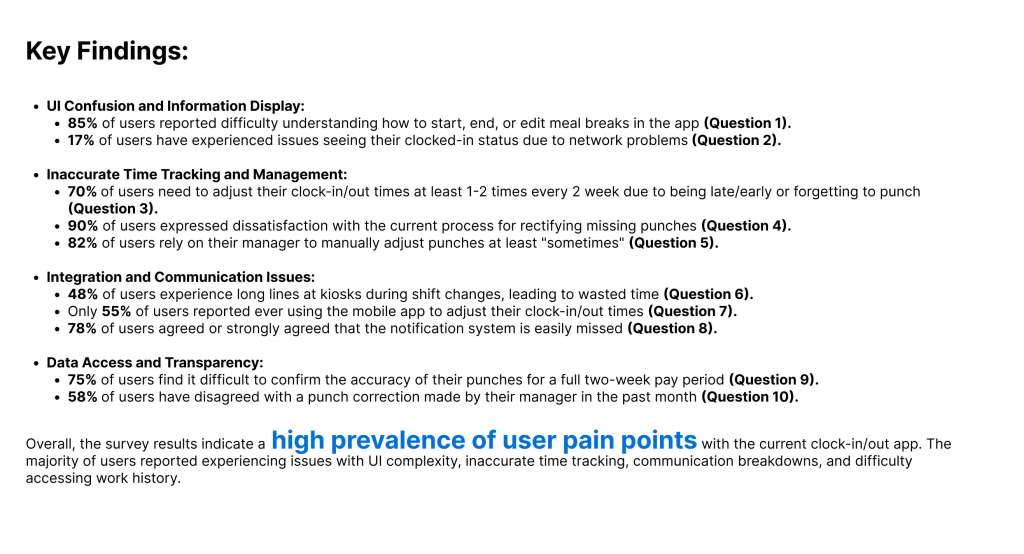
We sent the above questionnaire to 100+ associates across various demographics, age, and Walmart experience and below is the result we got
Survey Result and Key Findings
Mapping the Journey: From Persona to Prototype
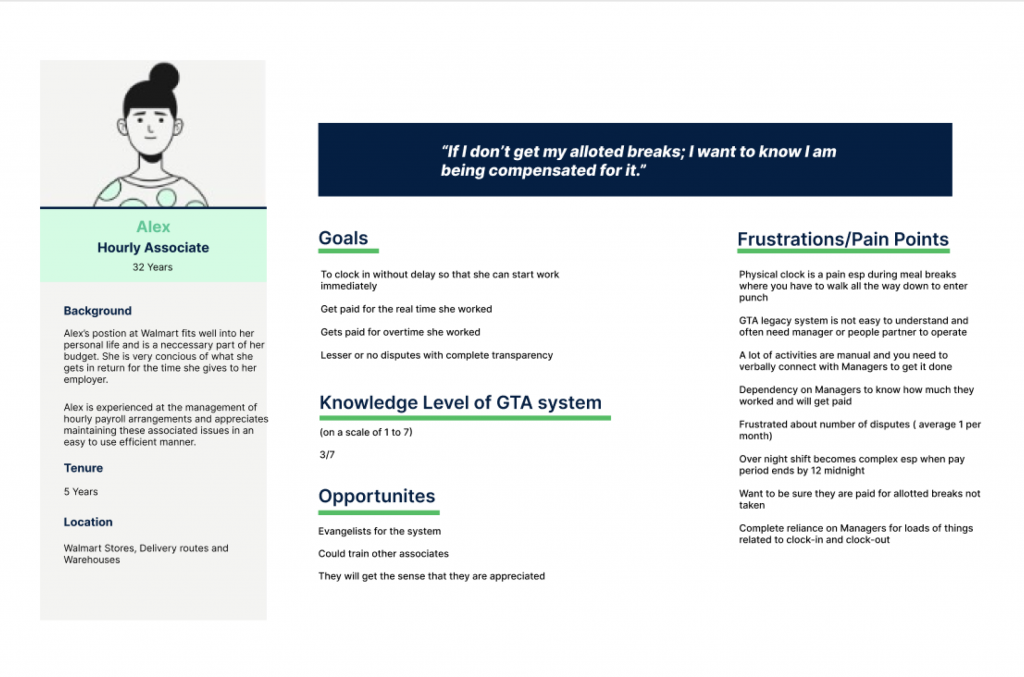
Next, we focused on building empathy. We crafted a detailed user persona, representing the diverse associate population.
Associate Persona
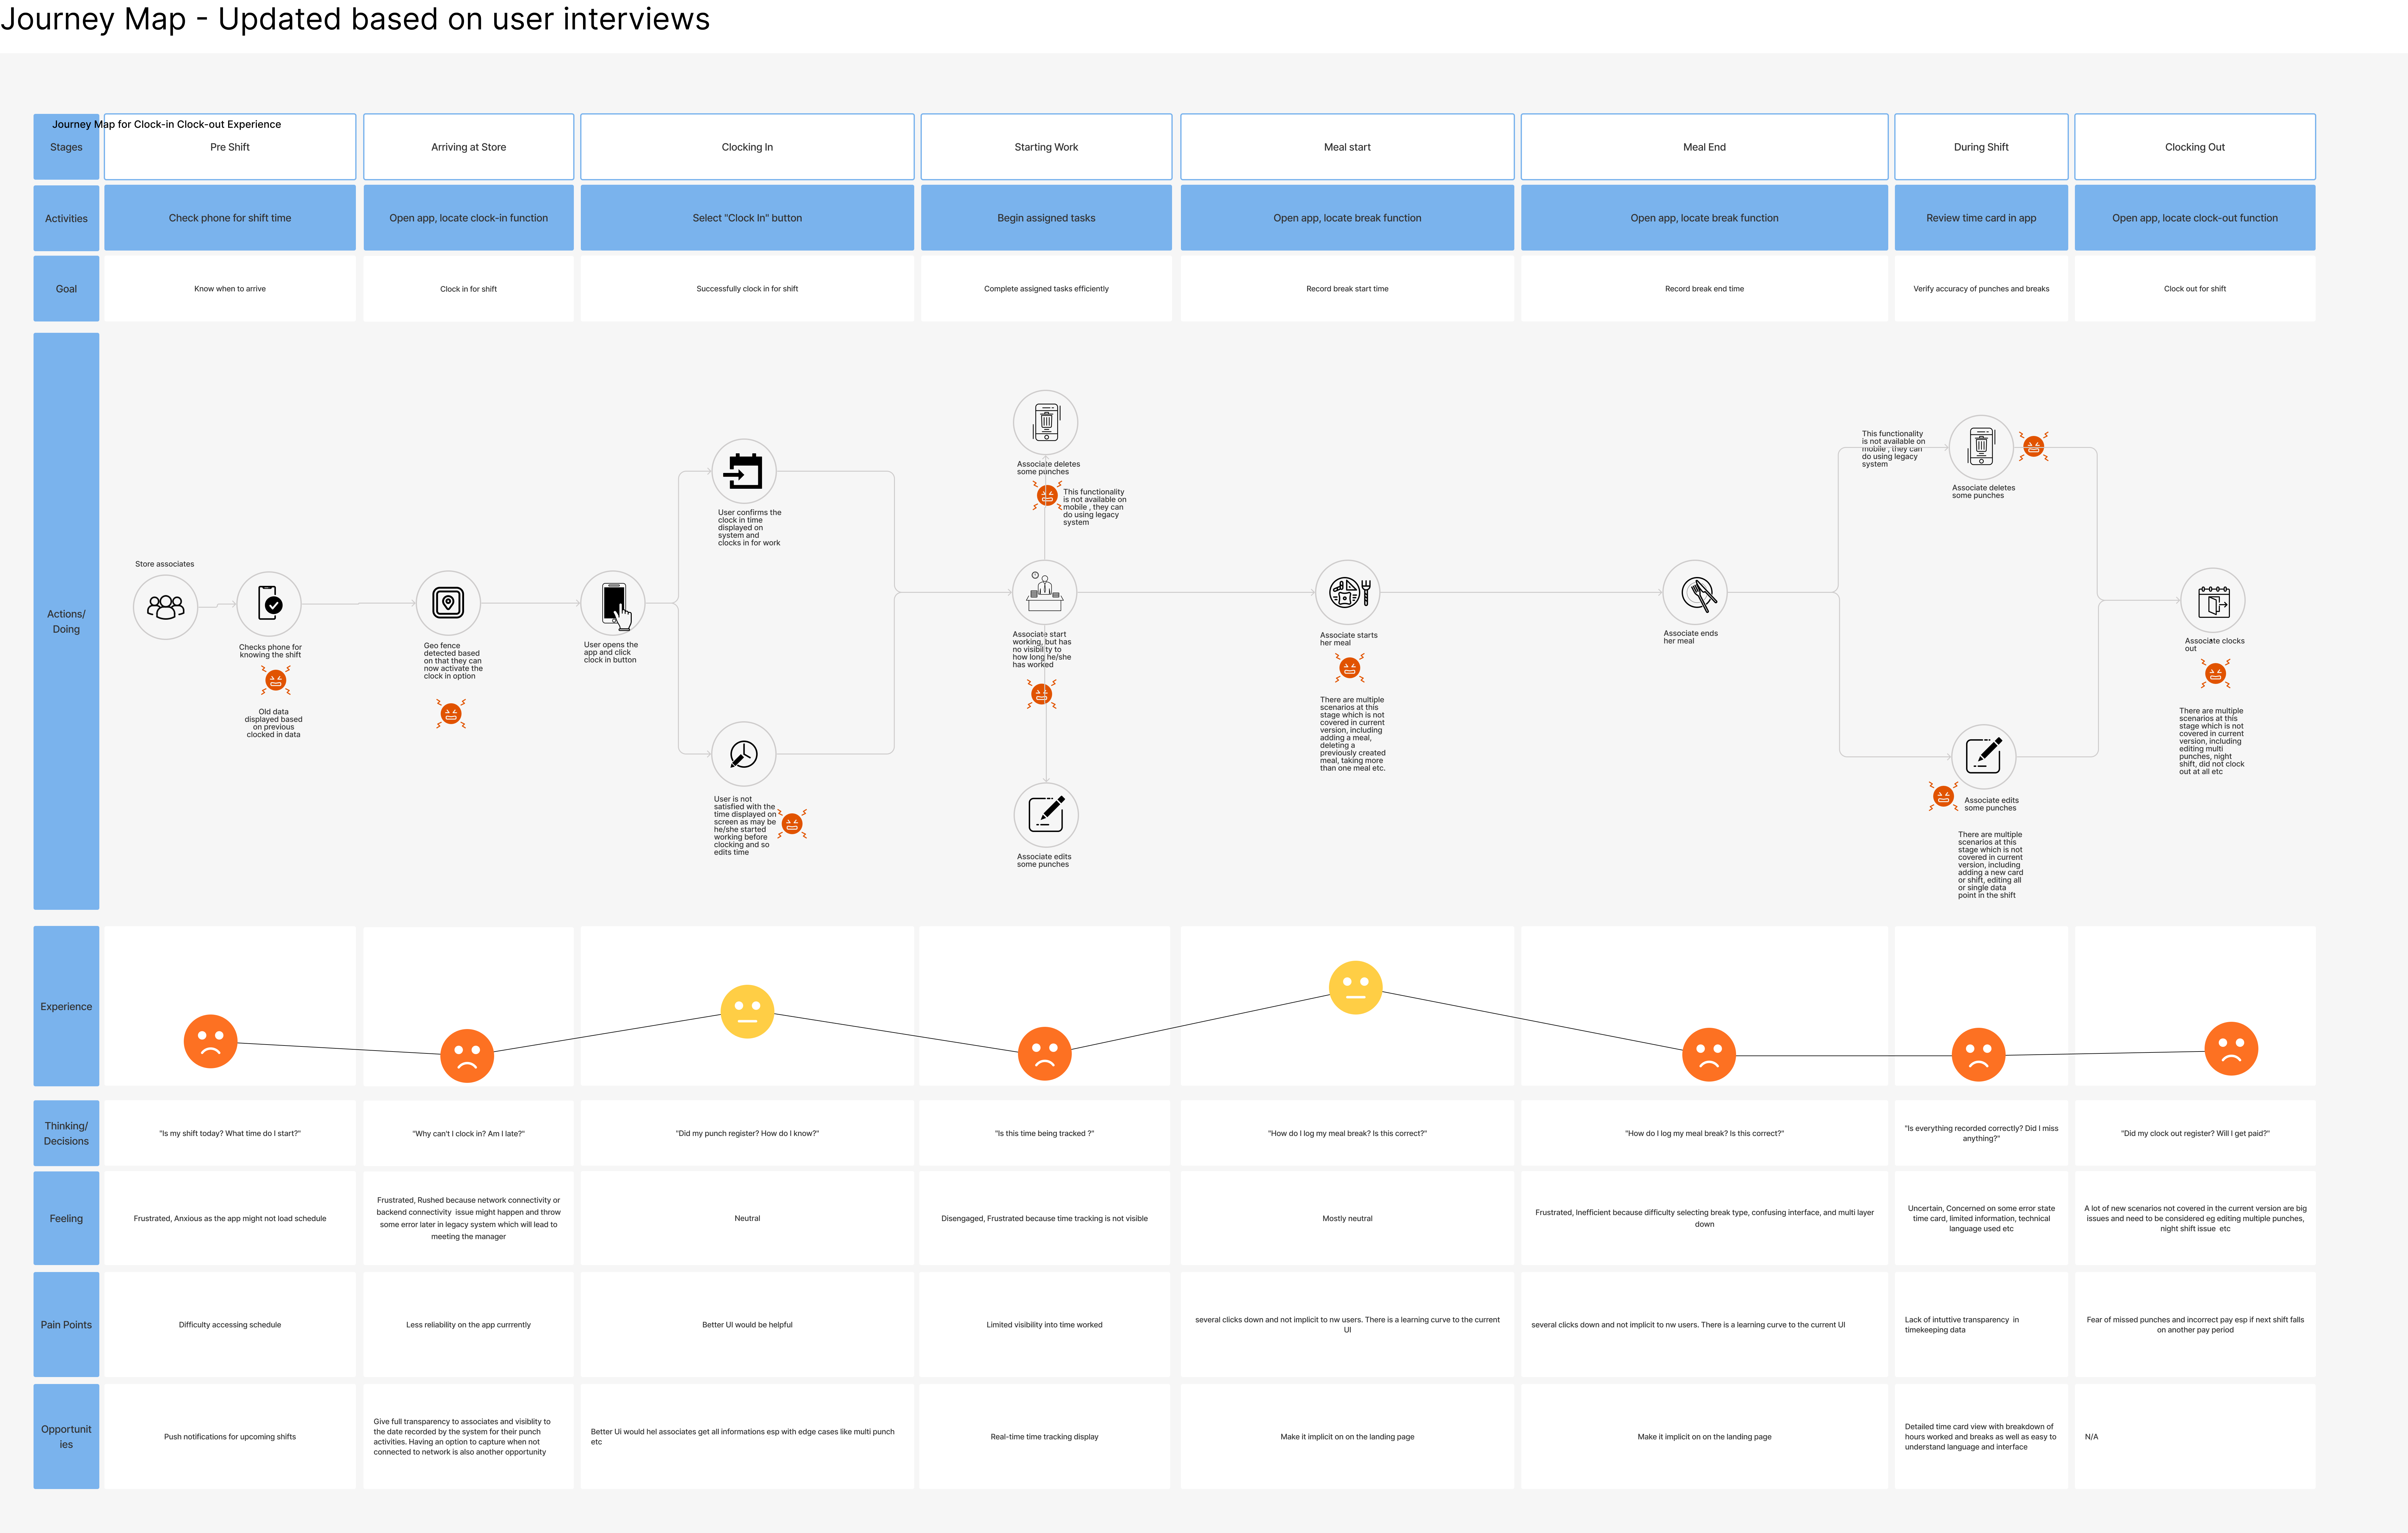
We revised the journey map, highlighting (the pain points gathered and verified from the survey) and emotional states at each stage of the clock-in/out process. This visualization exercise helped us step into the associates’ shoes and experience their frustrations firsthand.
New Journey Map
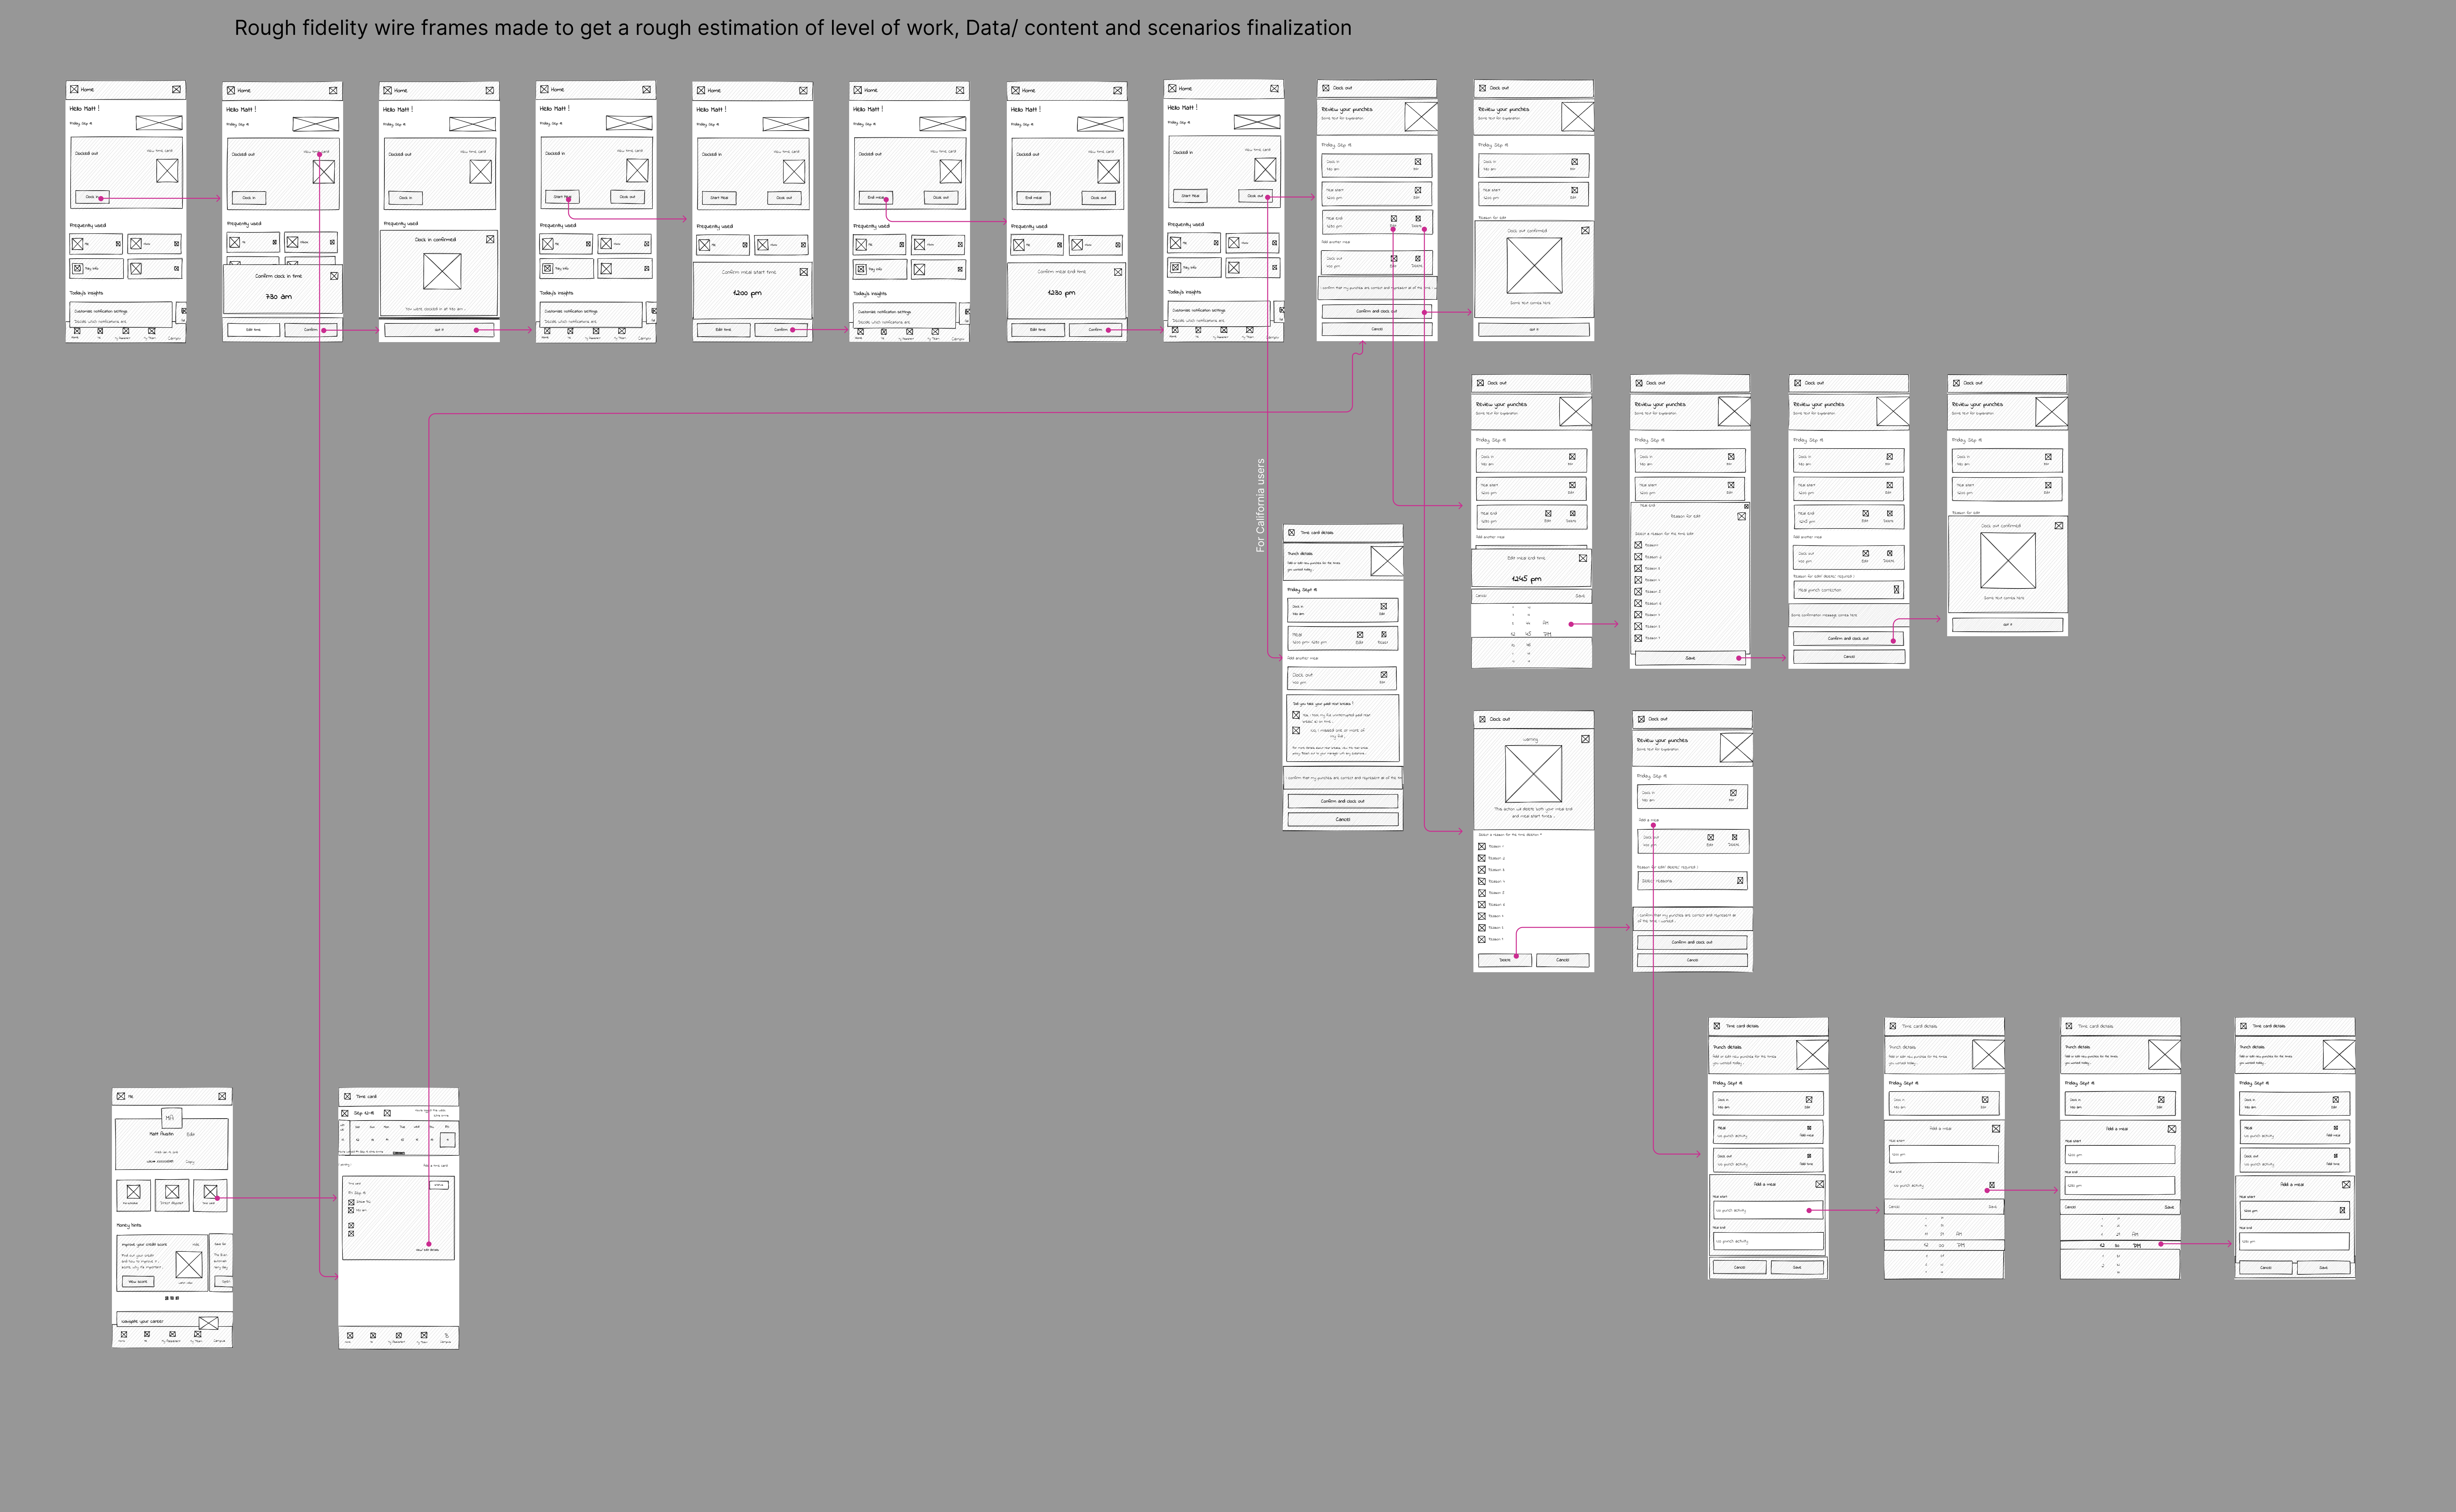
Leveraging the flowcharts created earlier, we took user journey mapping a step further. We built rough-fidelity end-to-end flow maps for each user scenario. These maps, devoid of visuals or data, served a crucial purpose:
Estimating screen count: We gained a preliminary understanding of the number of screens required.
Effort assessment: We could assess the design effort needed for each screen.
Roadmap refinement: Based on the findings, we could discuss potential adjustments to the project roadmap with the product team.
Content gathering context: Rough flows established a context for requesting data and content from product and engineering teams for each screen.
Below shows only the Happy path and 1-2 scenarios clubbed with Happy Path:
Partial Rough Fidelity- Showing only Happy path. We designed complete end to end rough fidelity of all 14 scenarios
From Chaos to Clarity: Building the Foundation
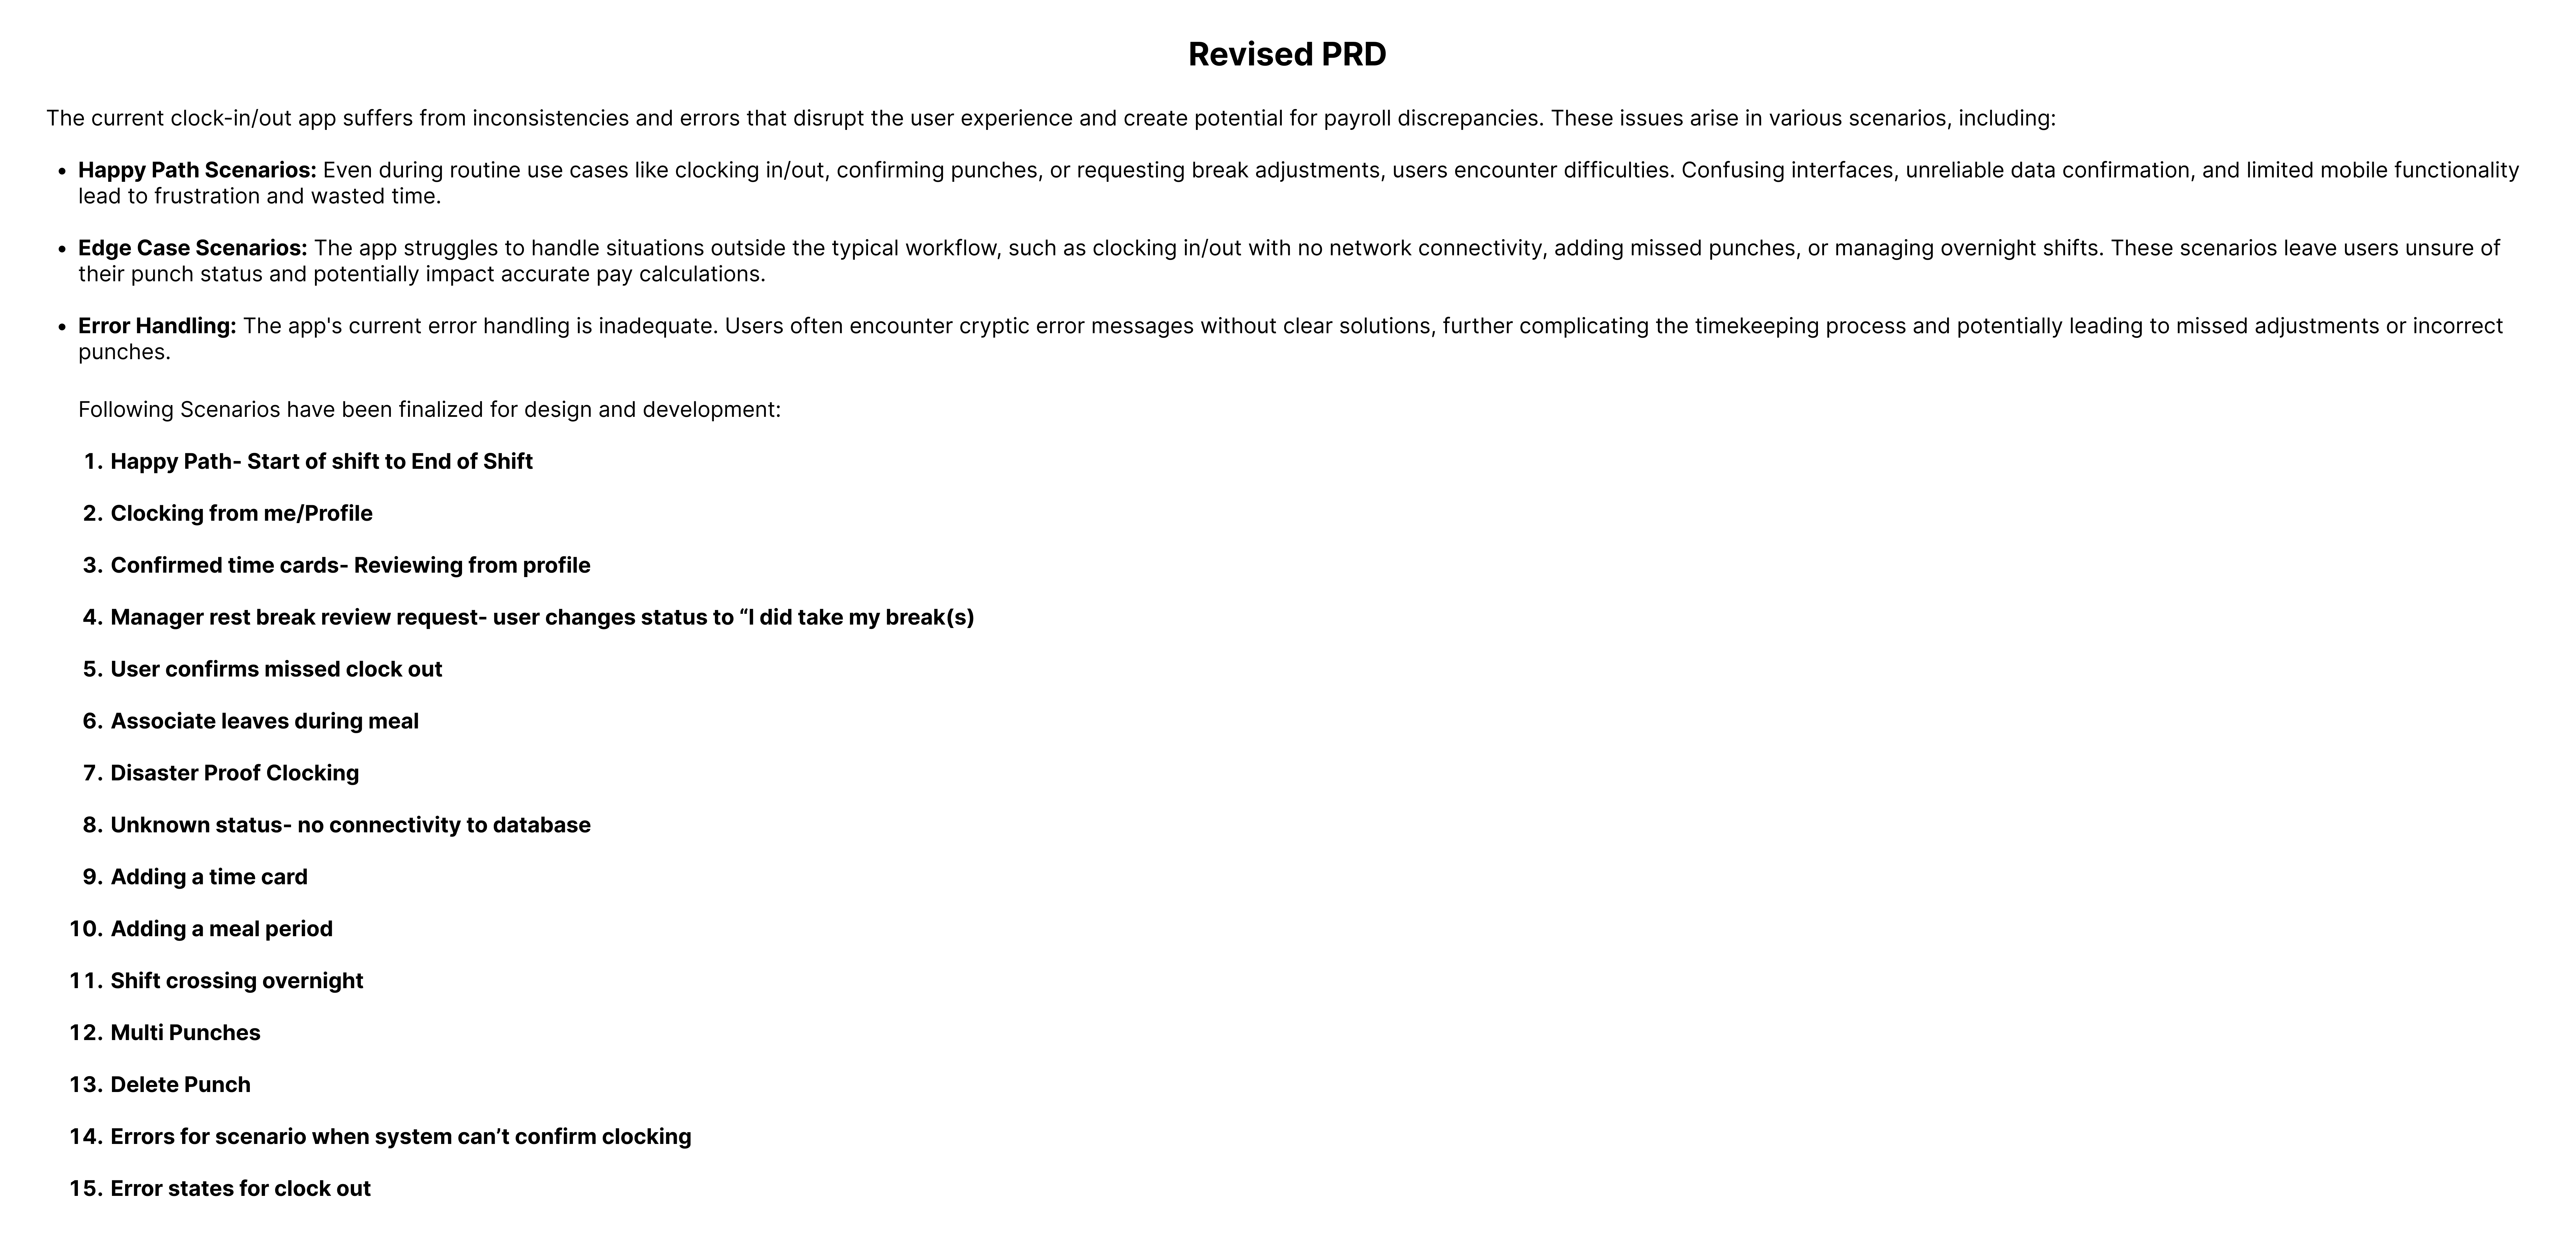
Armed with this newfound knowledge, we tackled the initial PRD limitations. We created a hierarchy of pain points, ensuring the most critical user needs were addressed first. We even uncovered edge cases, scenarios the initial document never considered. This user-centric approach provided a solid foundation for design decisions, guaranteeing the final app effectively addressed user pain points.
Revised PRD with Finalized Scenarios
From Rough to Real: The Power of Collaboration
These rough-fidelity prototypes became the cornerstone of collaboration. Presenting them to stakeholders from Business, Product, and Engineering ensured everyone was on the same page. We used them to:
Prioritize features for the Minimum Viable Product (MVP): We focused on the most critical user needs and functionalities for the initial release.
Refine user stories: Prototypes enabled us to capture detailed user interactions and expected outcomes in user stories.
Facilitate discussions with engineers: Prototypes sparked open communication with backend engineers and product managers, streamlining content creation and backend considerations.
Conduct usability testing: We tested the prototypes with a group of users, gathering valuable feedback to ensure we were on the right track.
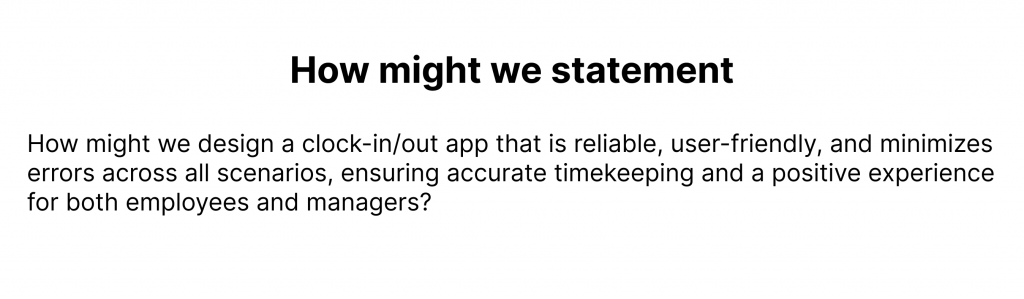
This rough fidelity wireframe and the revised PRD gave us a clear understanding of what we are to solution and thus we came with How might we statement which is as below:
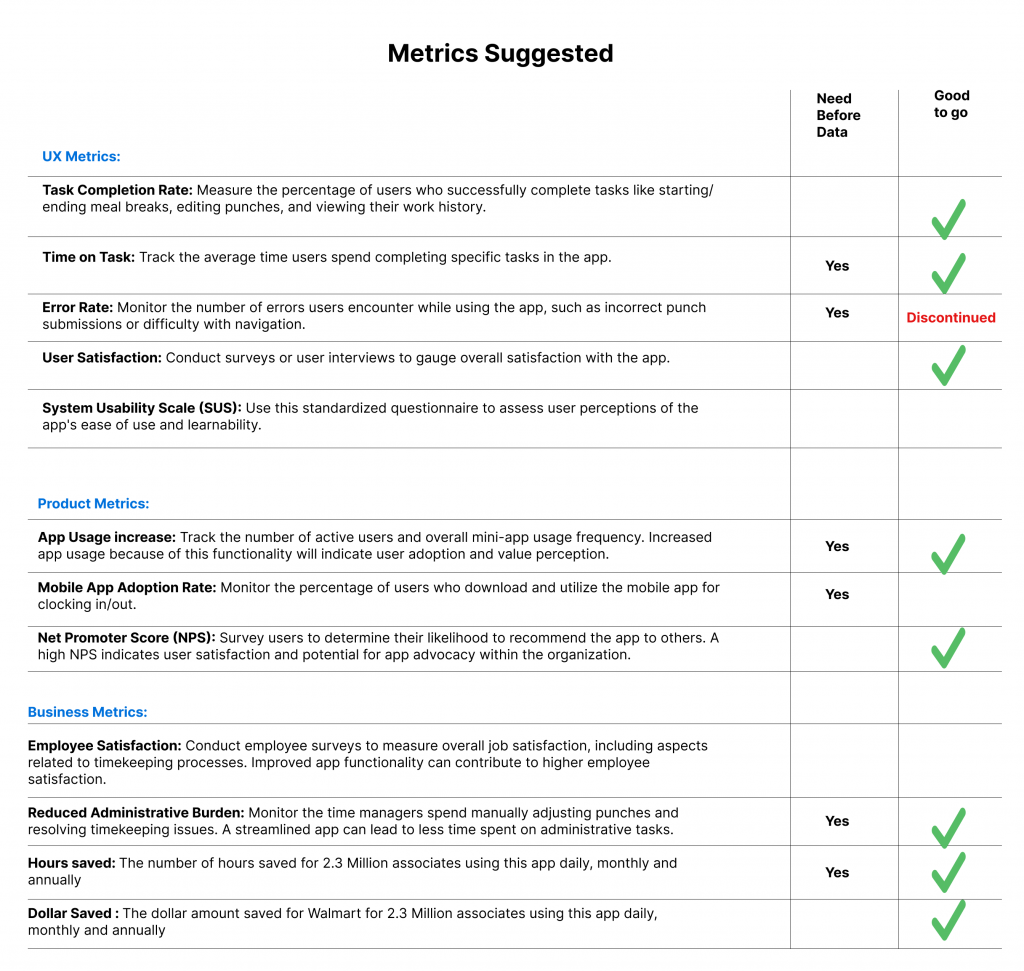
Time to define Metrics
After successfully finalizing requirements and validating all pain points, I embarked on a collaborative effort to define UX, Business, and Product Metrics. Through multiple meetings, we arrived at the following key metrics:
Identifying Baseline Data Needs
While defining our metrics, we identified a need for baseline data, which in some cases required user surveys. To gather this data, we conducted survey.
This user survey successfully provided us with the baseline metrics data. Here are the results:
Metrics before Data
The Road to Success: From Design to Development
With the MVP and priorities solidified, we meticulously refined individual user flows and scenarios. Daily collaboration was paramount. We embraced Walmart’s design system and conducted brainstorming sessions. Content and design decisions were constantly refined based on internal discussions and user testing.
Accessibility was a core tenet throughout the process. Our Figma handoff files adhered to WCAG 2.0 standards for users with disabilities. Detailed instructions and clear written notes accompanied the visuals to guide the development team. Regular check-ins ensured development remained aligned with our design vision.
Happy Path Hi Fidelity
Beyond the Handoff: Guardians of the User Experience
Our commitment extended beyond the handoff. We transformed into a dedicated Visual Quality Assurance (VQA) team, meticulously scrutinizing every screen in the live development environment. We examined UI elements, responsive behavior, and user flows, ensuring they mirrored our design specifications. Open communication with the development team ensured any discrepancies were promptly addressed.
The Final Chapter: A Success Story
This user-centered design odyssey resulted in a streamlined and intuitive mobile app that addressed
Final Metrics
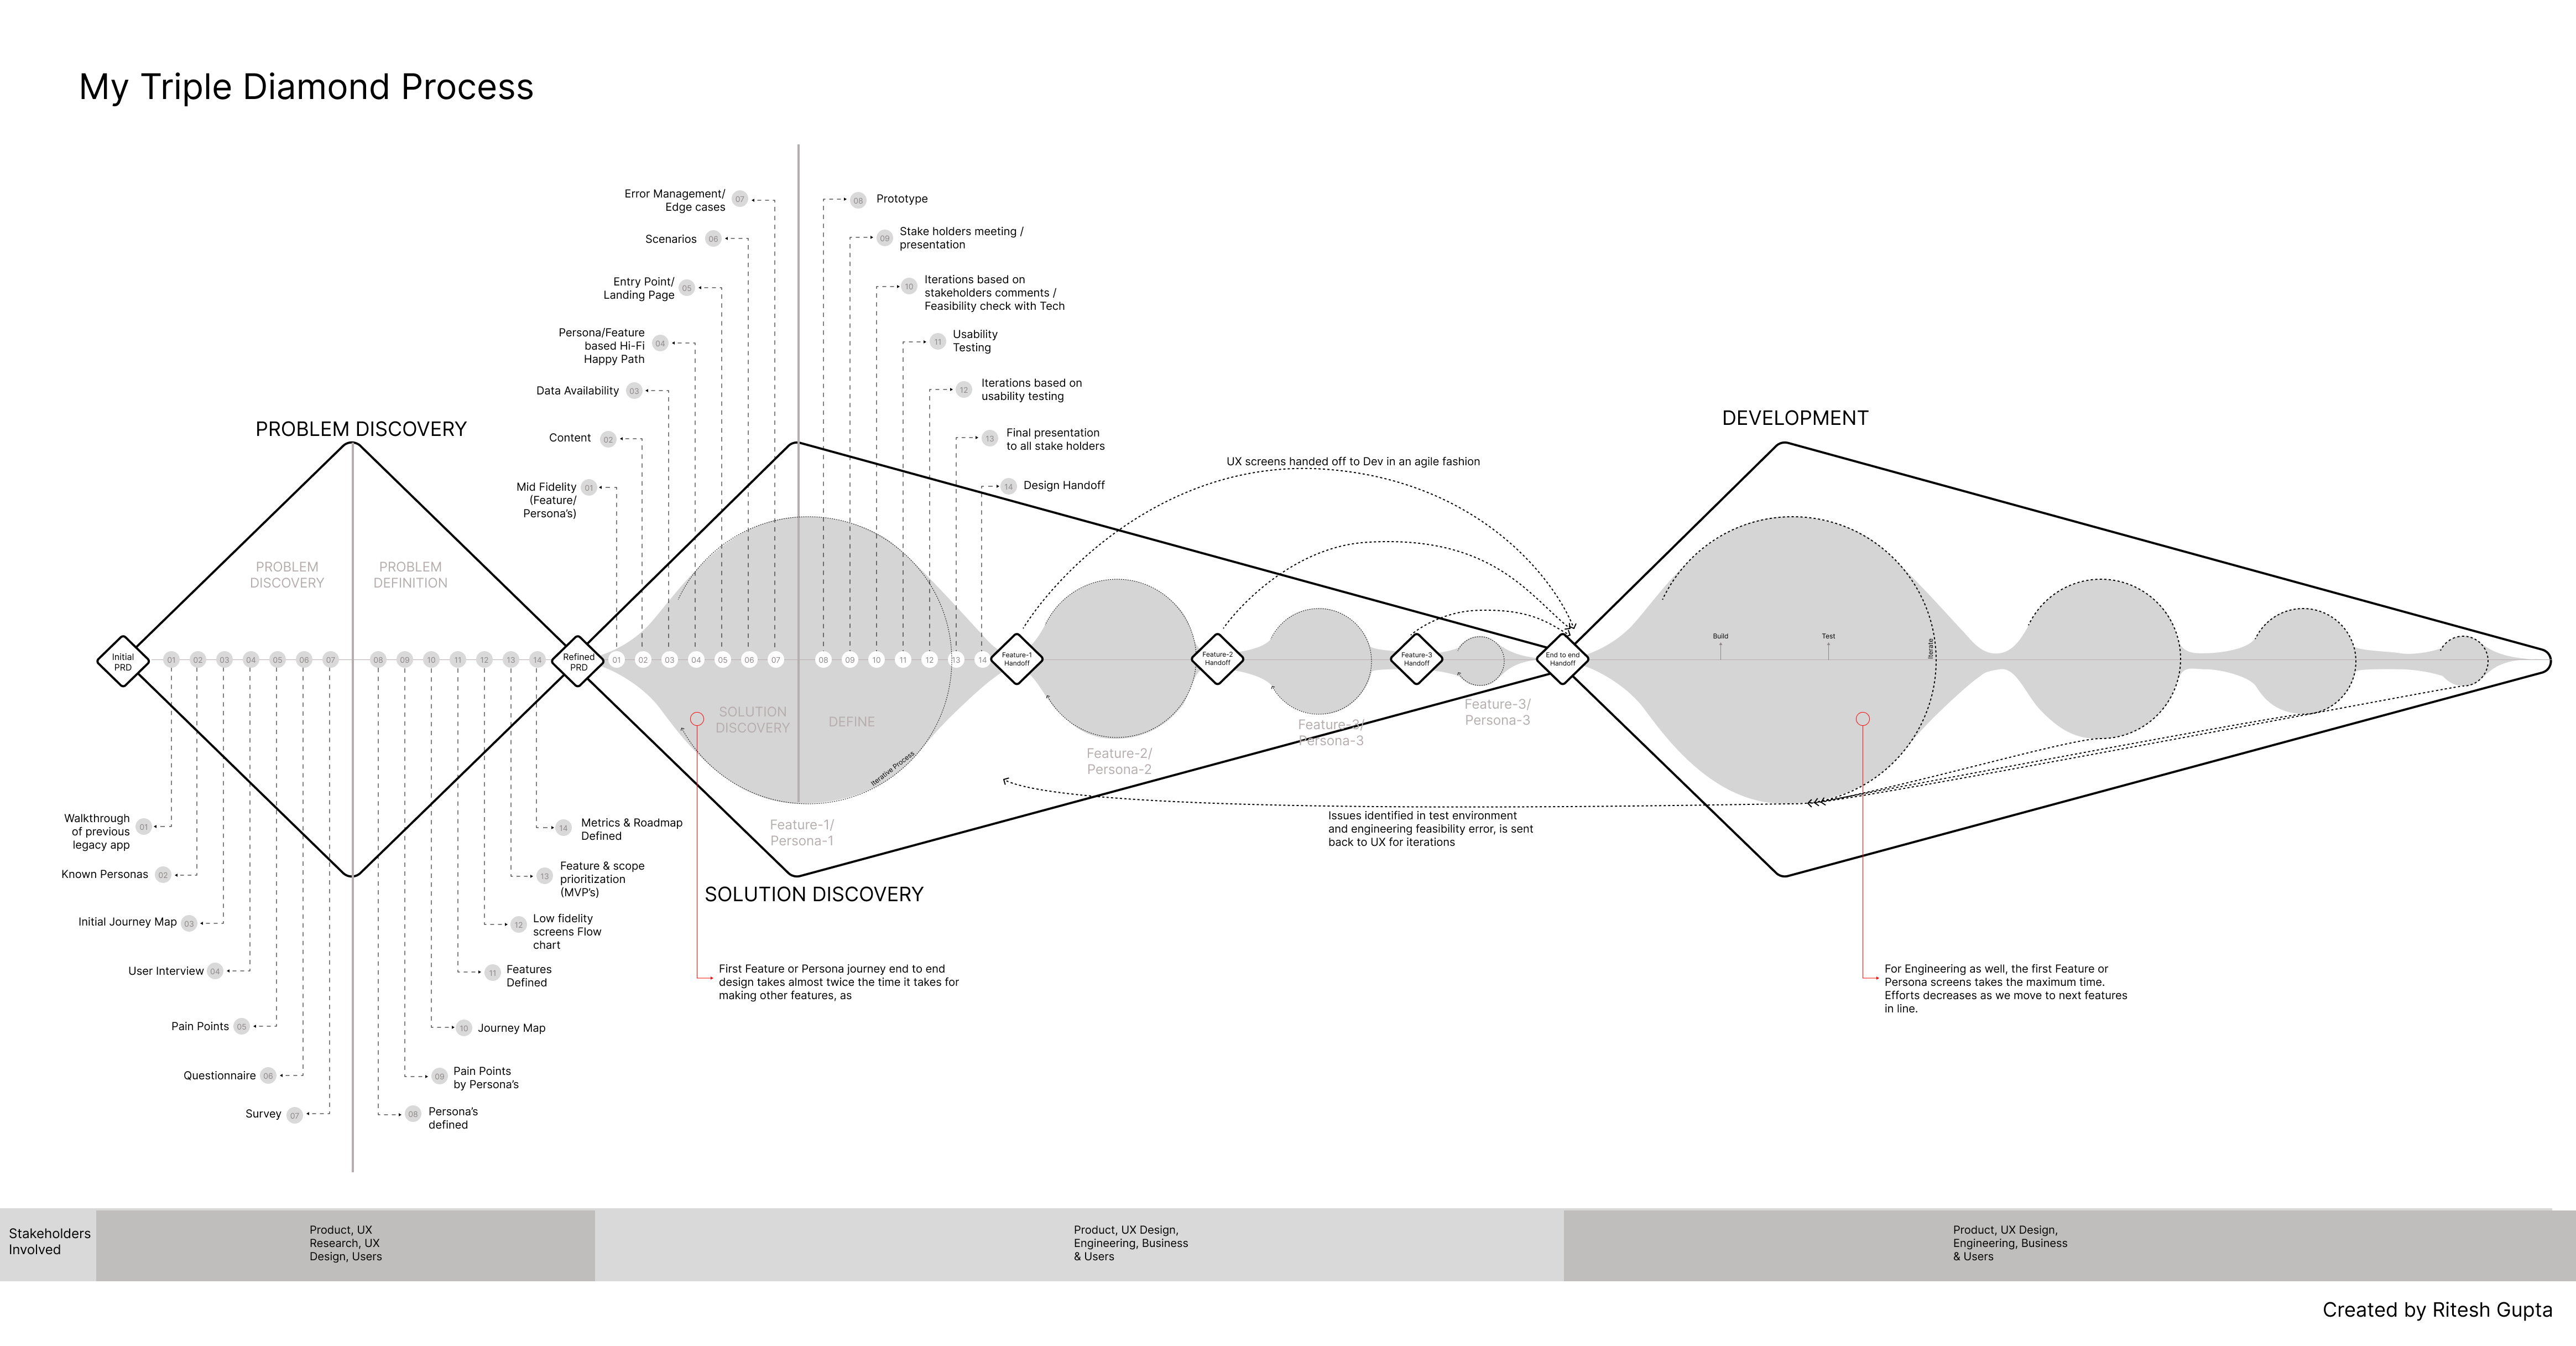
Triple Diamond Process
In this project I followed the Triple Diamond Process. I primarily utilize the Triple Diamond Process, with the understanding that the discovery phase (first diamond) can vary in length depending on project complexity and the initial Product Requirements Document (PRD). This phase can range from a single sprint to a few months, determined through careful due diligence that considers product complexity, timeframes, and available resources. Below is an infographic of the Triple Diamond method: