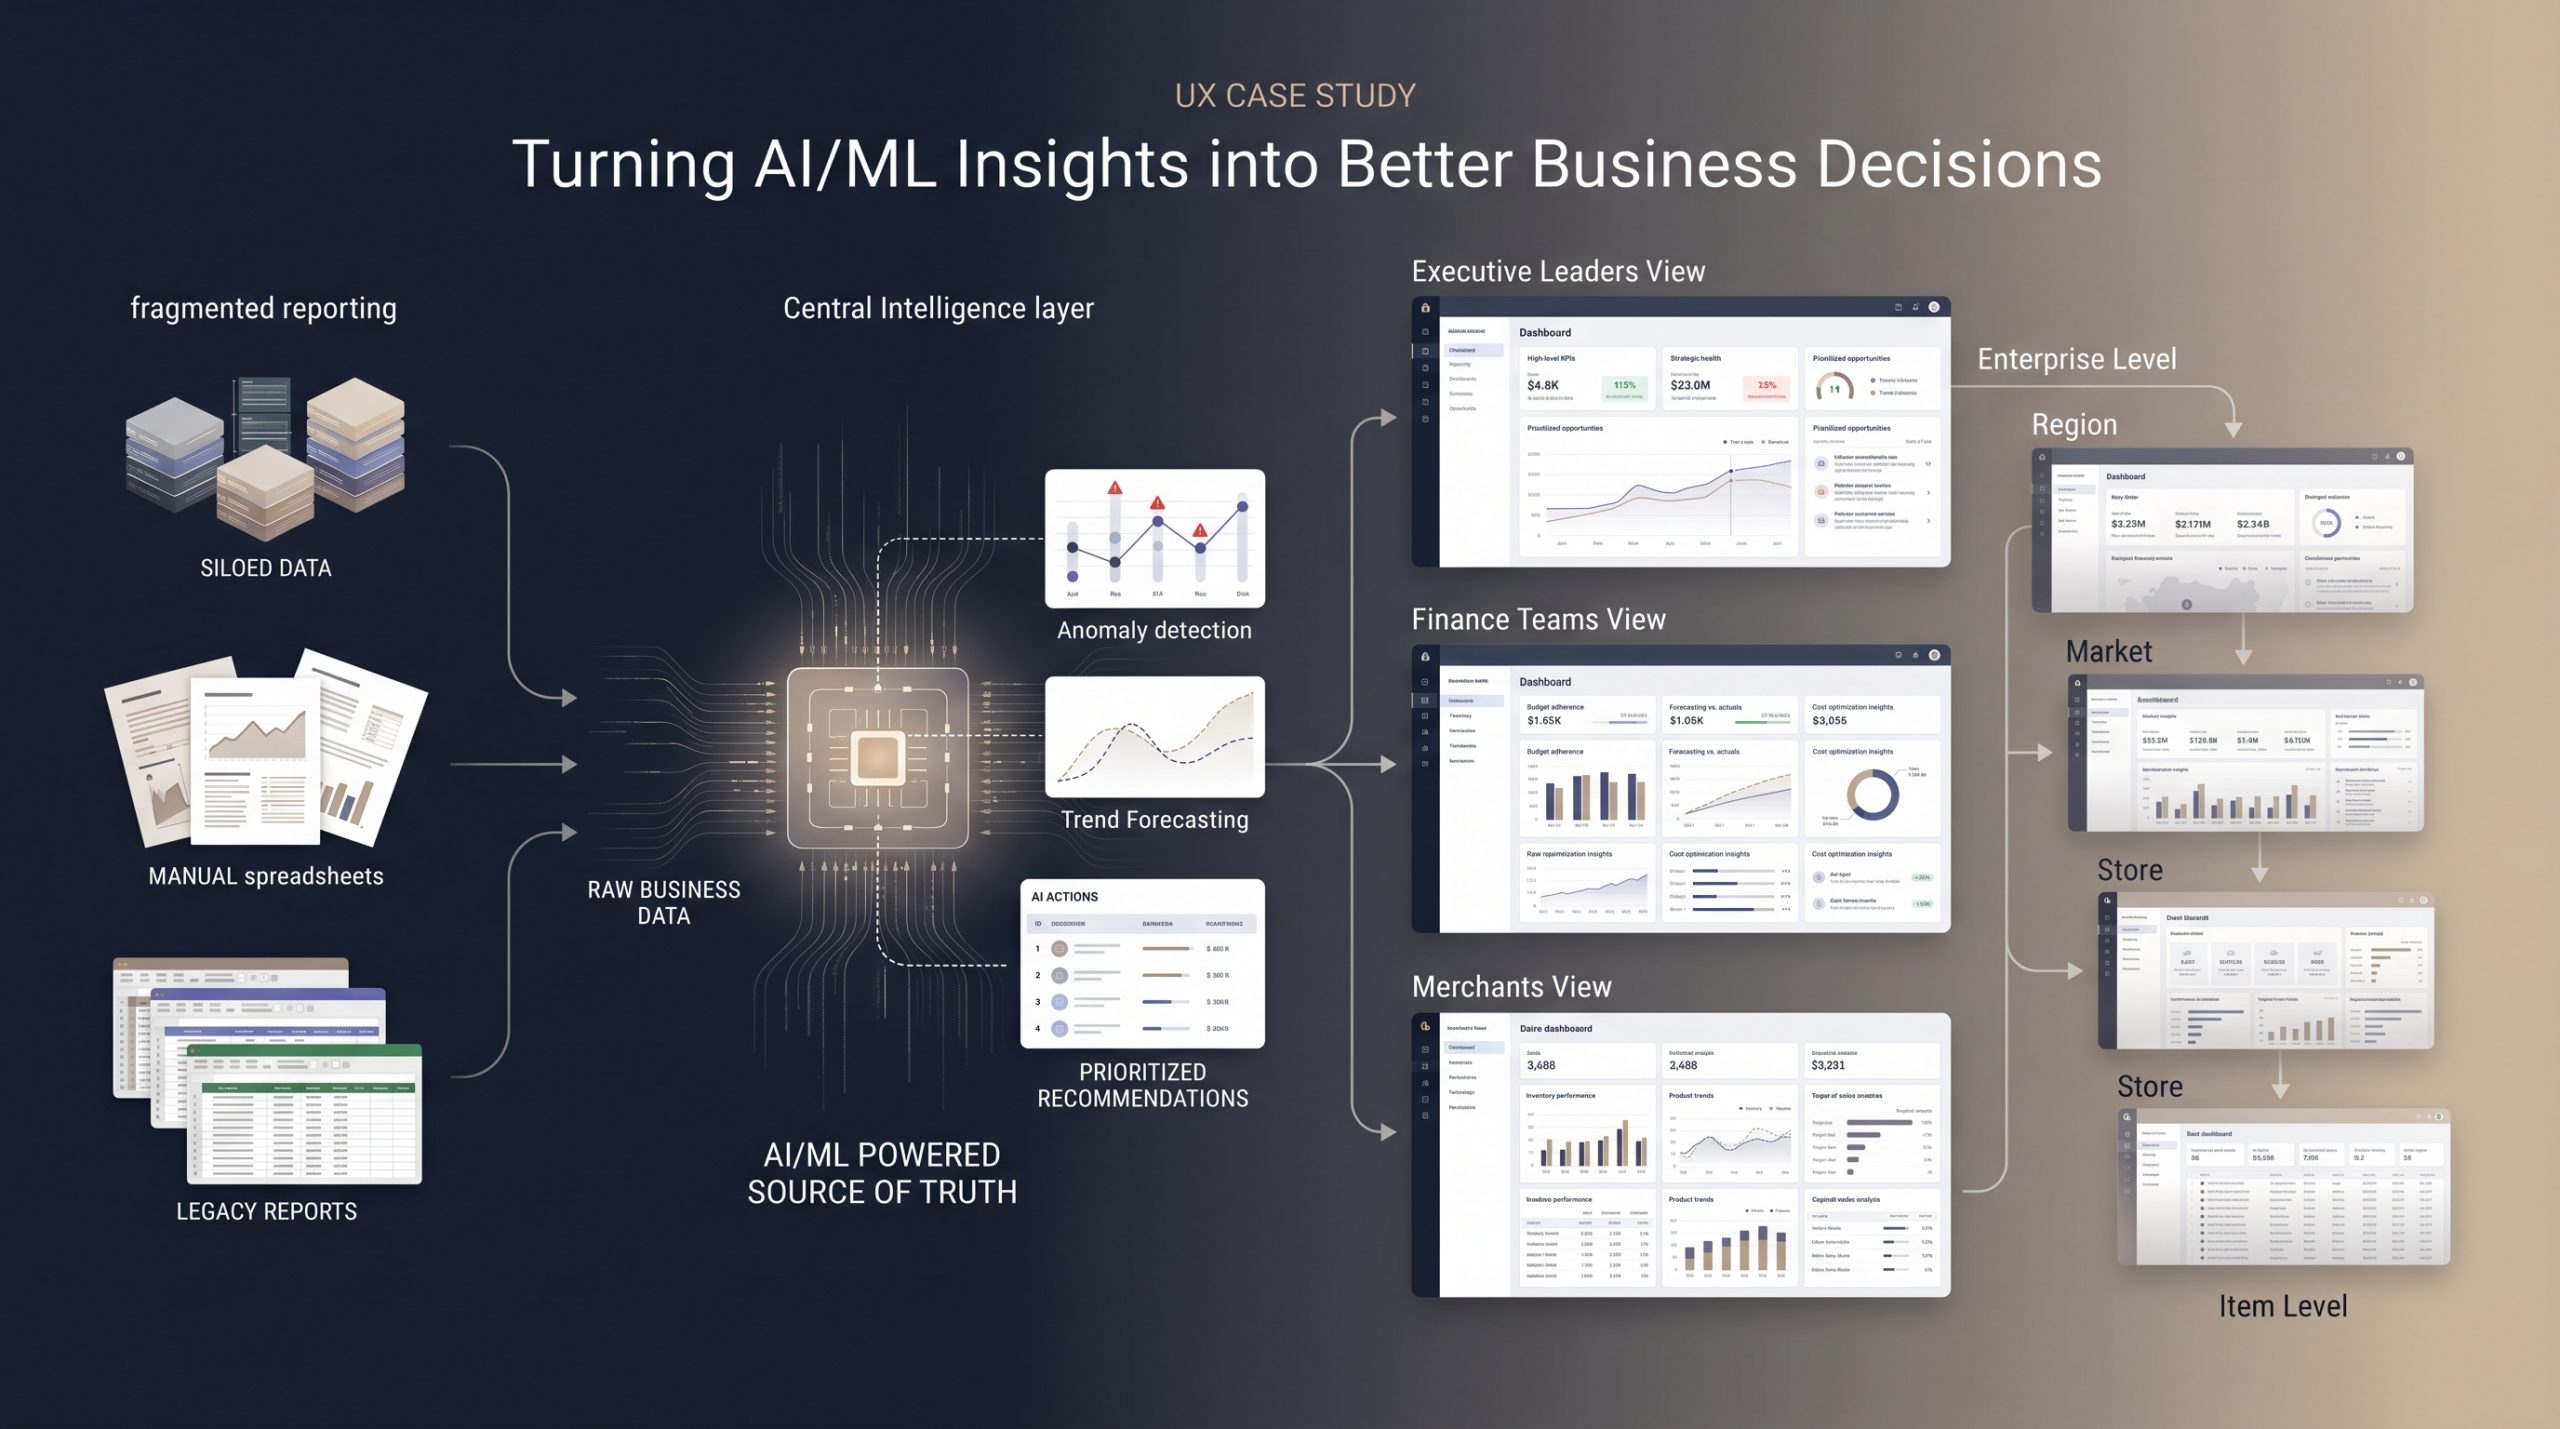
A role-aware enterprise insights platform that replaced fragmented reporting workflows with scalable drill-down visibility for merchants, finance teams, and leadership.
Impact Snapshot
- Replaced 30+ dashboards and consolidated 40+ reports
- Reduced manual reporting effort by 68%
- Reduced decision-making time from 2 days to 1 hour
- Reduced Excel dependency by 90%
- Achieved 85% user satisfaction
- Reached 40% adoption during 2020–2022 rollout
- Enabled role-aware insights for finance, merchandising, international, and leadership teams
Overview
IR Portal was an AI/ML-powered enterprise insights platform designed to help Walmart teams move from fragmented reporting and manual analysis toward faster, more confident business decisions. The platform served merchants, finance teams, supply chain partners, category teams, business leaders, and executive stakeholders, giving each role access to the level of insight most relevant to them.
Before IR Portal, users relied on multiple Power BI reports, separate consumption layers, and significant Excel-based manipulation to understand trends, investigate anomalies, and make decisions. This created inconsistency in metrics, low trust in data, heavy dependency on analysts and BI teams, and long delays in turning information into action. I led UX strategy for the platform and helped shape a role-aware experience that unified reporting into a single source of truth, introduced AI/ML-generated insights, and enabled users to drill from company-level signals down to market, county, store, or item-level drivers with speed and clarity.
The Strategic Problem
The challenge was not simply that reporting was fragmented—it was that decision-making itself had become fragmented.
Different teams were using different slices of raw data, generating their own charts, and drawing separate conclusions in Excel or disconnected reports. As a result, leaders often entered the same conversation with different numbers for the same financial or merchandising issue. There was no unified source of truth, no shared metric confidence, and no scalable way to move from signal to action.
At the same time, users lacked a self-serve application that could support both high-level business oversight and deep diagnostic exploration. Insights were buried across reports, difficult to compare, slow to investigate, and often dependent on analysts or BI teams to interpret. Reporting was largely static and descriptive, not actionable. Teams could not easily go from an enterprise-level anomaly to understanding whether the issue was isolated to a few stores, driven by a regional pattern, or tied to a specific item.
This created several business problems at once:
- too much time spent stitching data together manually
- low trust in metrics due to inconsistent calculations across teams
- weak self-service exploration for different business roles
- slow movement from insight to decision
- heavy Excel dependency
- limited visibility from top-level performance to root-cause detail
- no intelligent, role-aware way to surface what mattered most to each user
The opportunity was to turn a fragmented reporting ecosystem into a unified, insight-driven decision platform.
My Role as a Leader
I served as UX Lead on the initiative and was responsible for shaping the experience from a workflow, systems, and stakeholder alignment perspective.
My role included:
- leading UX strategy
- defining information architecture
- creating workflow and drill-down models
- designing dashboards and interactions
- conducting research
- facilitating stakeholder workshops
- influencing product direction and roadmap
- aligning merchandising, finance, and leadership stakeholders
- managing designers
- partnering closely with engineering, data teams, and data scientists
A key part of my contribution was helping teams view the problem as an ecosystem challenge, not a dashboard challenge. The platform needed to solve for trust, actionability, role-based complexity, and performance—not just visualizing data. I helped shape an experience that made insight discovery intuitive, role-relevant, and easy to act on without requiring users to learn a complicated reporting tool.
Stakeholder Alignment
The platform supported a wide range of users across merchandising, finance, supply chain, category teams, international teams, business leadership, and executive leaders. Each audience needed different levels of abstraction, different views of the business, and different paths to action.
This made alignment especially important. One of the biggest organizational pain points was inconsistency: different teams were bringing different versions of the truth into leadership discussions because each group had its own way of extracting and interpreting data. That created confusion, slowed decision-making, and reduced confidence in the underlying numbers.
I helped align stakeholders around a different model: one shared platform, one semantic foundation, and one role-aware experience that could serve varied business needs without compromising trust or consistency. By connecting user needs, workflow models, and system behavior, I helped drive a shared understanding of what the platform needed to achieve:
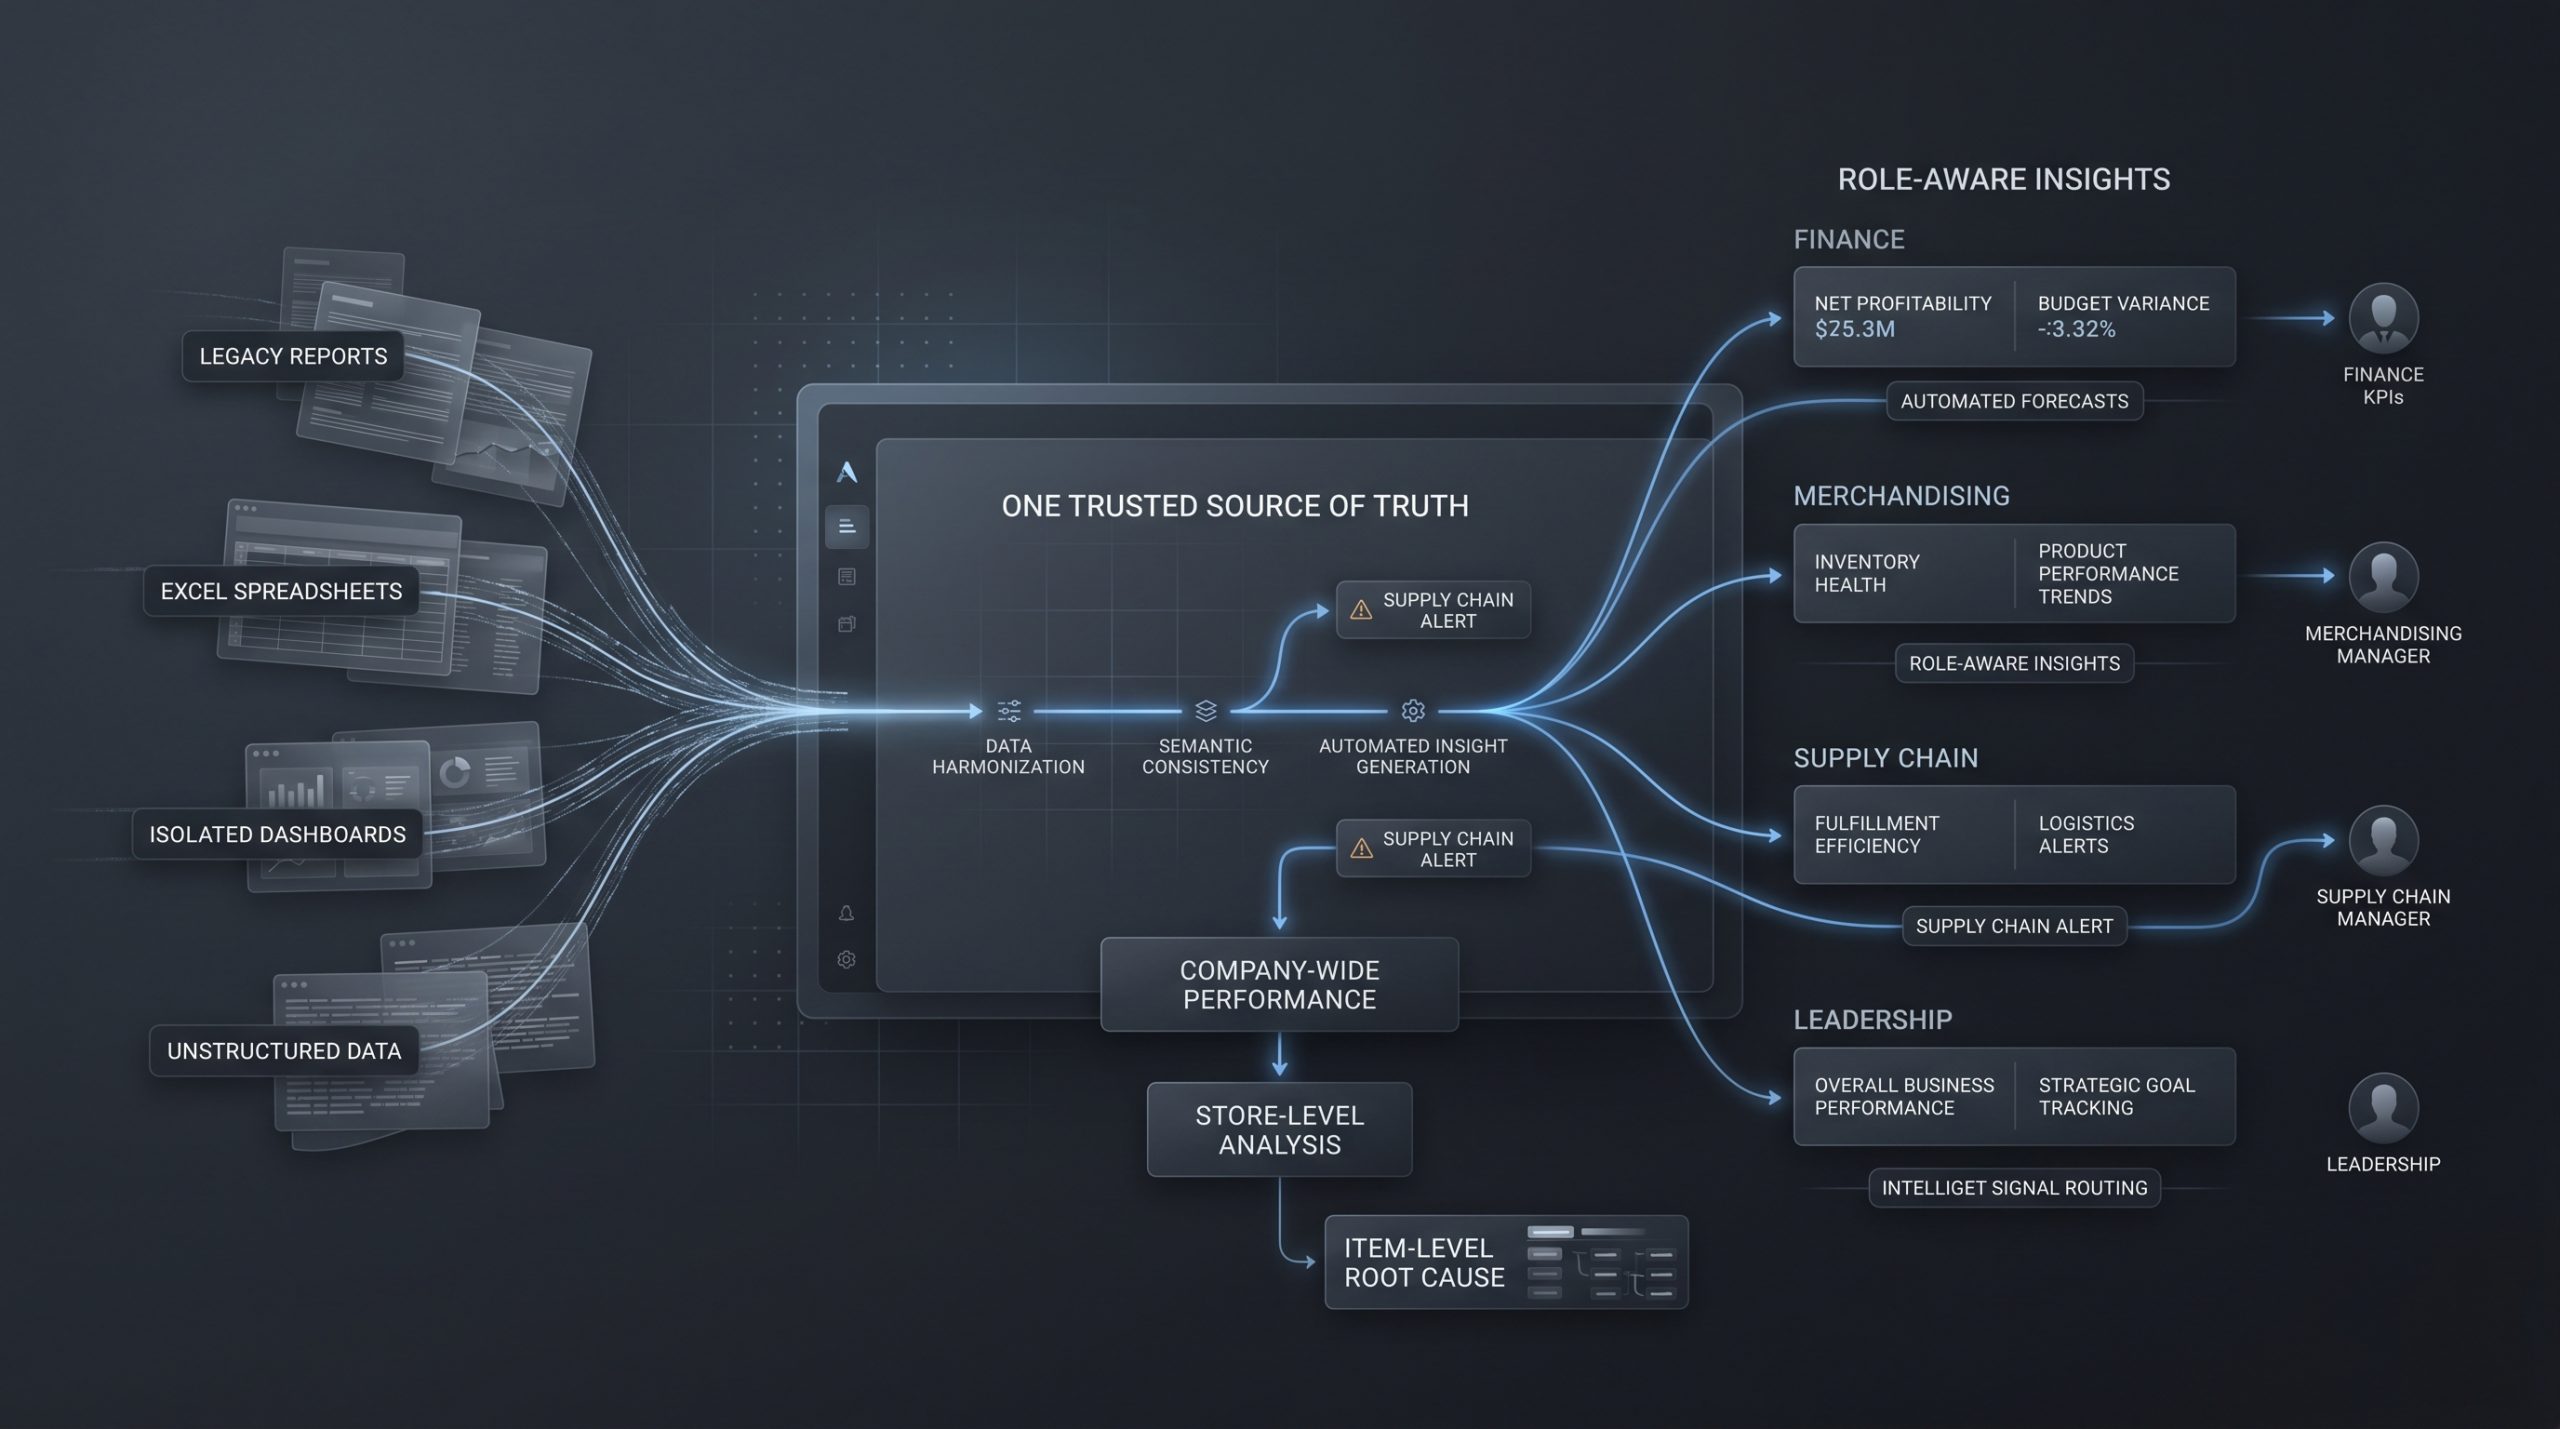
- unify reporting into a single trusted source of truth
- reduce dependence on analysts and manual spreadsheets
- surface machine-generated insights at the right level for the right role
- make drill-down exploration intuitive
- improve speed from issue detection to business action
This alignment was especially important as the platform matured from multiple Power BI reports to its own consumption layer and then into a more scalable semantic-model-based architecture.
Approach
The design effort focused on making a highly complex data ecosystem understandable, actionable, and efficient for different business roles.
The work required close collaboration across UX, product, engineering, and data science. Because the platform was both data-heavy and performance-sensitive, the experience design had to account not only for usability, but also for how insights were generated, stored, surfaced, and refreshed in ways that could support near-real-time decision-making.
A major design principle was preserving the exploratory freedom users valued in Excel while removing the inconsistency, manual effort, and cognitive burden that came with it. Instead of expecting users to derive meaning from raw tables or separate reports, the platform was designed to surface relevant insights proactively and then support deeper exploration through flexible drill-down pathways and filters.
The result was an experience that balanced:
- complexity and clarity
- flexibility and consistency
- high-level oversight and deep investigation
- AI/ML-generated signals and user-controlled exploration
Key Design Moves
Several design decisions were central to the success of the platform:
Unified fragmented reporting into one platform
We replaced a disconnected ecosystem of reports, consumption layers, and manual spreadsheets with a more coherent platform that served as a single destination for trusted insights and exploration.
Created a single source of truth
One of the most important shifts was semantic consistency. The platform brought users onto a more unified data model so that different teams were no longer presenting different answers to the same business question.
Introduced role-based personalization
Different users saw different views, priorities, and levels of abstraction based on their role. This made the platform more relevant for merchants, finance teams, leadership, and other business stakeholders without forcing everyone into the same reporting experience.
Designed AI/ML-generated insights into the workflow
The platform did more than visualize raw data. It surfaced machine-generated insights including anomaly detection, trend identification, recommendations, forecasts, prioritized actions, and role-relevant signals so users could focus on what mattered most.
Built intuitive drill-down architecture
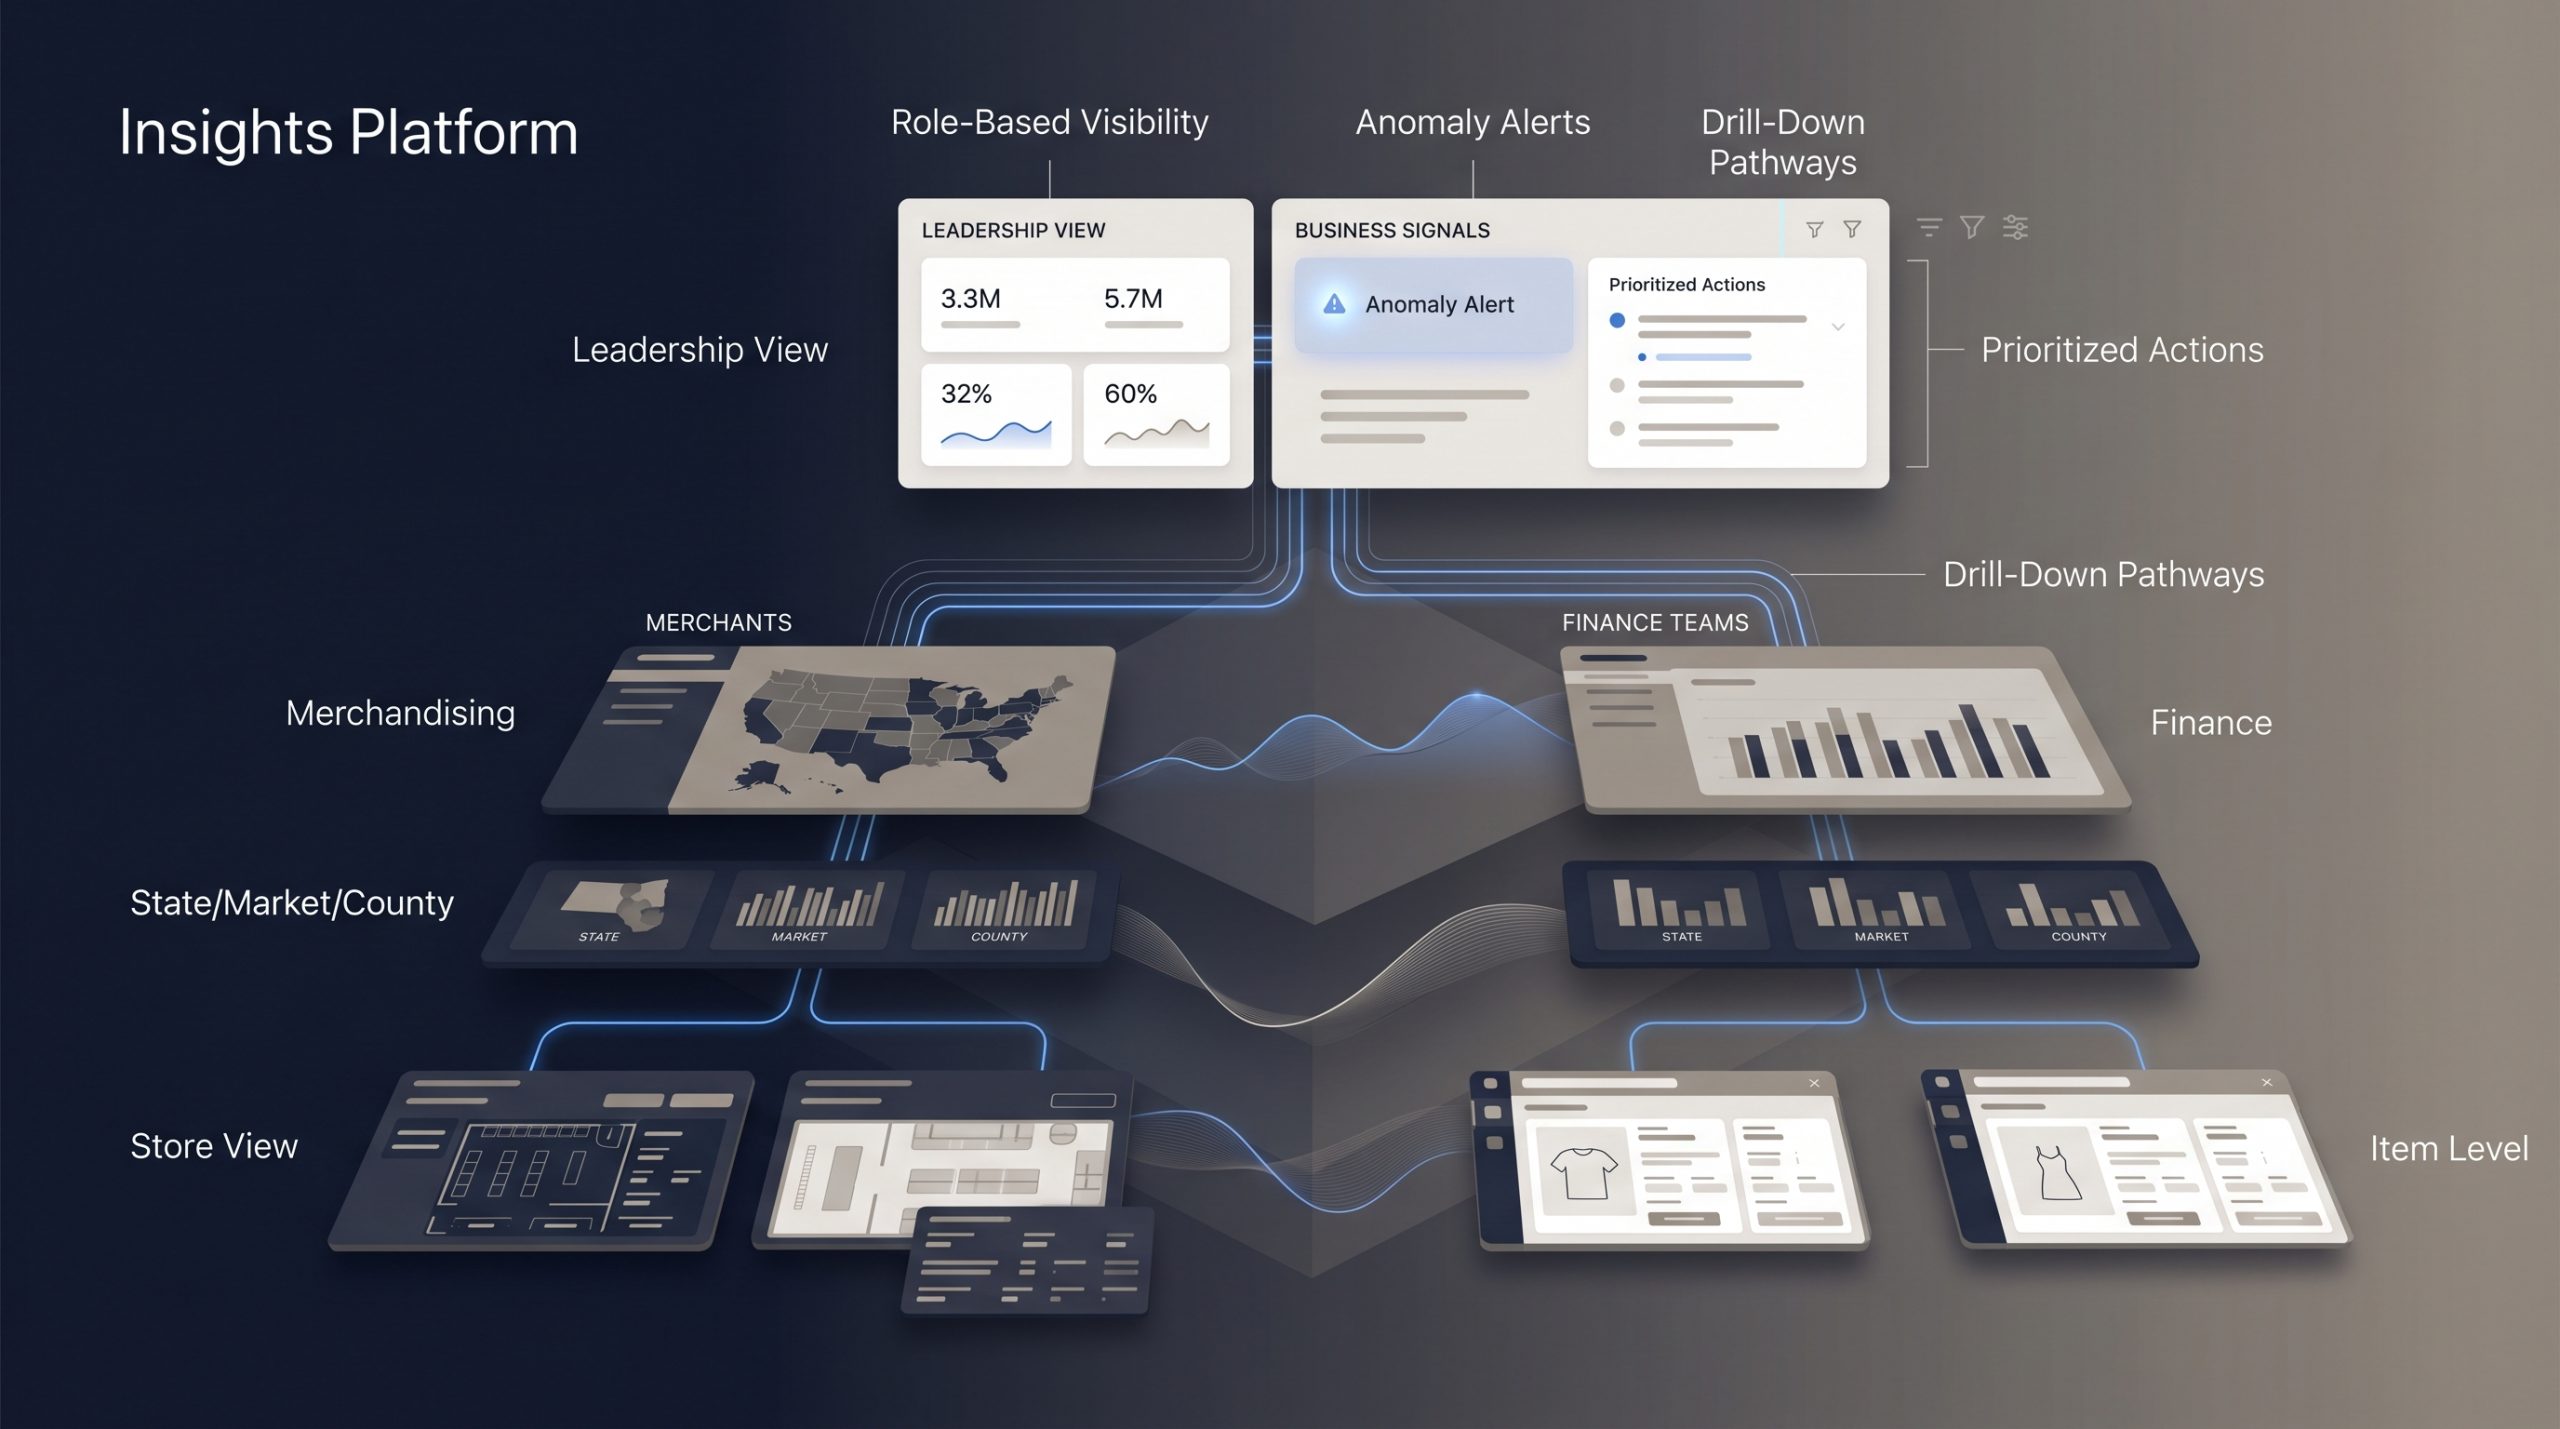
Users could move from enterprise-level signals to increasingly granular views. One drill-down path helped leaders trace patterns from company level to state, market, county, and store level to determine whether an issue was localized or systemic. Another path supported item-level exploration, helping teams understand whether anomalies were tied to specific products, categories, or broader patterns.
Made insights more actionable
Instead of static reports, the experience emphasized insight-to-action workflows through summaries, explanations, comparisons, and prioritized signals that helped users move faster from observation to decision.
Improved navigation and exploratory filtering
The platform supported flexible filtering and exploration without overwhelming users, helping them “play with the data” in a more guided and reliable way than traditional spreadsheet-based workflows.
AI/ML Capability
A defining aspect of IR Portal was its AI/ML-driven intelligence layer.
The system automatically generated insights from raw business data and surfaced them to the right users at the right level. These capabilities included:
- automatically generated insights
- anomaly and outlier detection
- trend identification
- recommendation surfacing
- performance forecasting
- prioritized actions
- role-aware visibility into relevant issues and opportunities
This changed the nature of the user experience. Instead of requiring users to search for patterns manually, the platform could proactively bring forward what required attention—helping leadership understand where issues existed, who needed to act, and what level of the business to investigate next.
Outcome
The platform delivered meaningful improvements in both operational efficiency and decision support.
Impact included:
- 30+ dashboards replaced
- 40+ reports consolidated
- 68% reduction in manual reporting effort
- decision-making time reduced from 2 days to 1 hour
- 90% reduction in Excel dependency
- 85% user satisfaction
- 40% adoption during the rollout period from 2020–2022
Beyond the metrics, the platform helped teams trust the data more confidently, move faster from issue detection to action, and make better decisions without relying on fragmented reporting workflows. It created a more scalable and intelligent model for enterprise insights—one where leaders could work from the same source of truth, understand what mattered most, and drill to the right level of detail without unnecessary friction.
What I Learned
This work reinforced that enterprise analytics products are not just reporting tools—they are decision-making systems.
When trust in data is low, every downstream decision becomes harder. When users depend on spreadsheets and disconnected reports, the problem is not just inefficiency—it is organizational misalignment. Designing for enterprise decision support means designing for trust, clarity, actionability, and role-aware complexity all at once.
It also reinforced the value of thinking about AI/ML not as a feature layer, but as part of the product’s decision architecture. The strongest outcome was not simply that the platform surfaced more insights—it was that it helped the right people see the right signals, understand root causes more quickly, and act with more confidence.
Most importantly, this project showed how UX can connect data, business logic, system performance, and human decision-making into a more unified enterprise experience.
Short Portfolio Card Version
Turning AI/ML Insights into Better Business Decisions
I led UX for IR Portal, an AI/ML-powered enterprise insights platform that replaced fragmented reports, manual Excel workflows, and inconsistent metrics with a single source of truth for merchants, finance teams, and leadership. By introducing role-based views, machine-generated insights, intuitive drill-downs, and more actionable decision flows, the platform consolidated 40+ reports, replaced 30+ dashboards, reduced manual reporting effort by 68%, cut decision-making time from 2 days to 1 hour, and reduced Excel dependency by 90%.